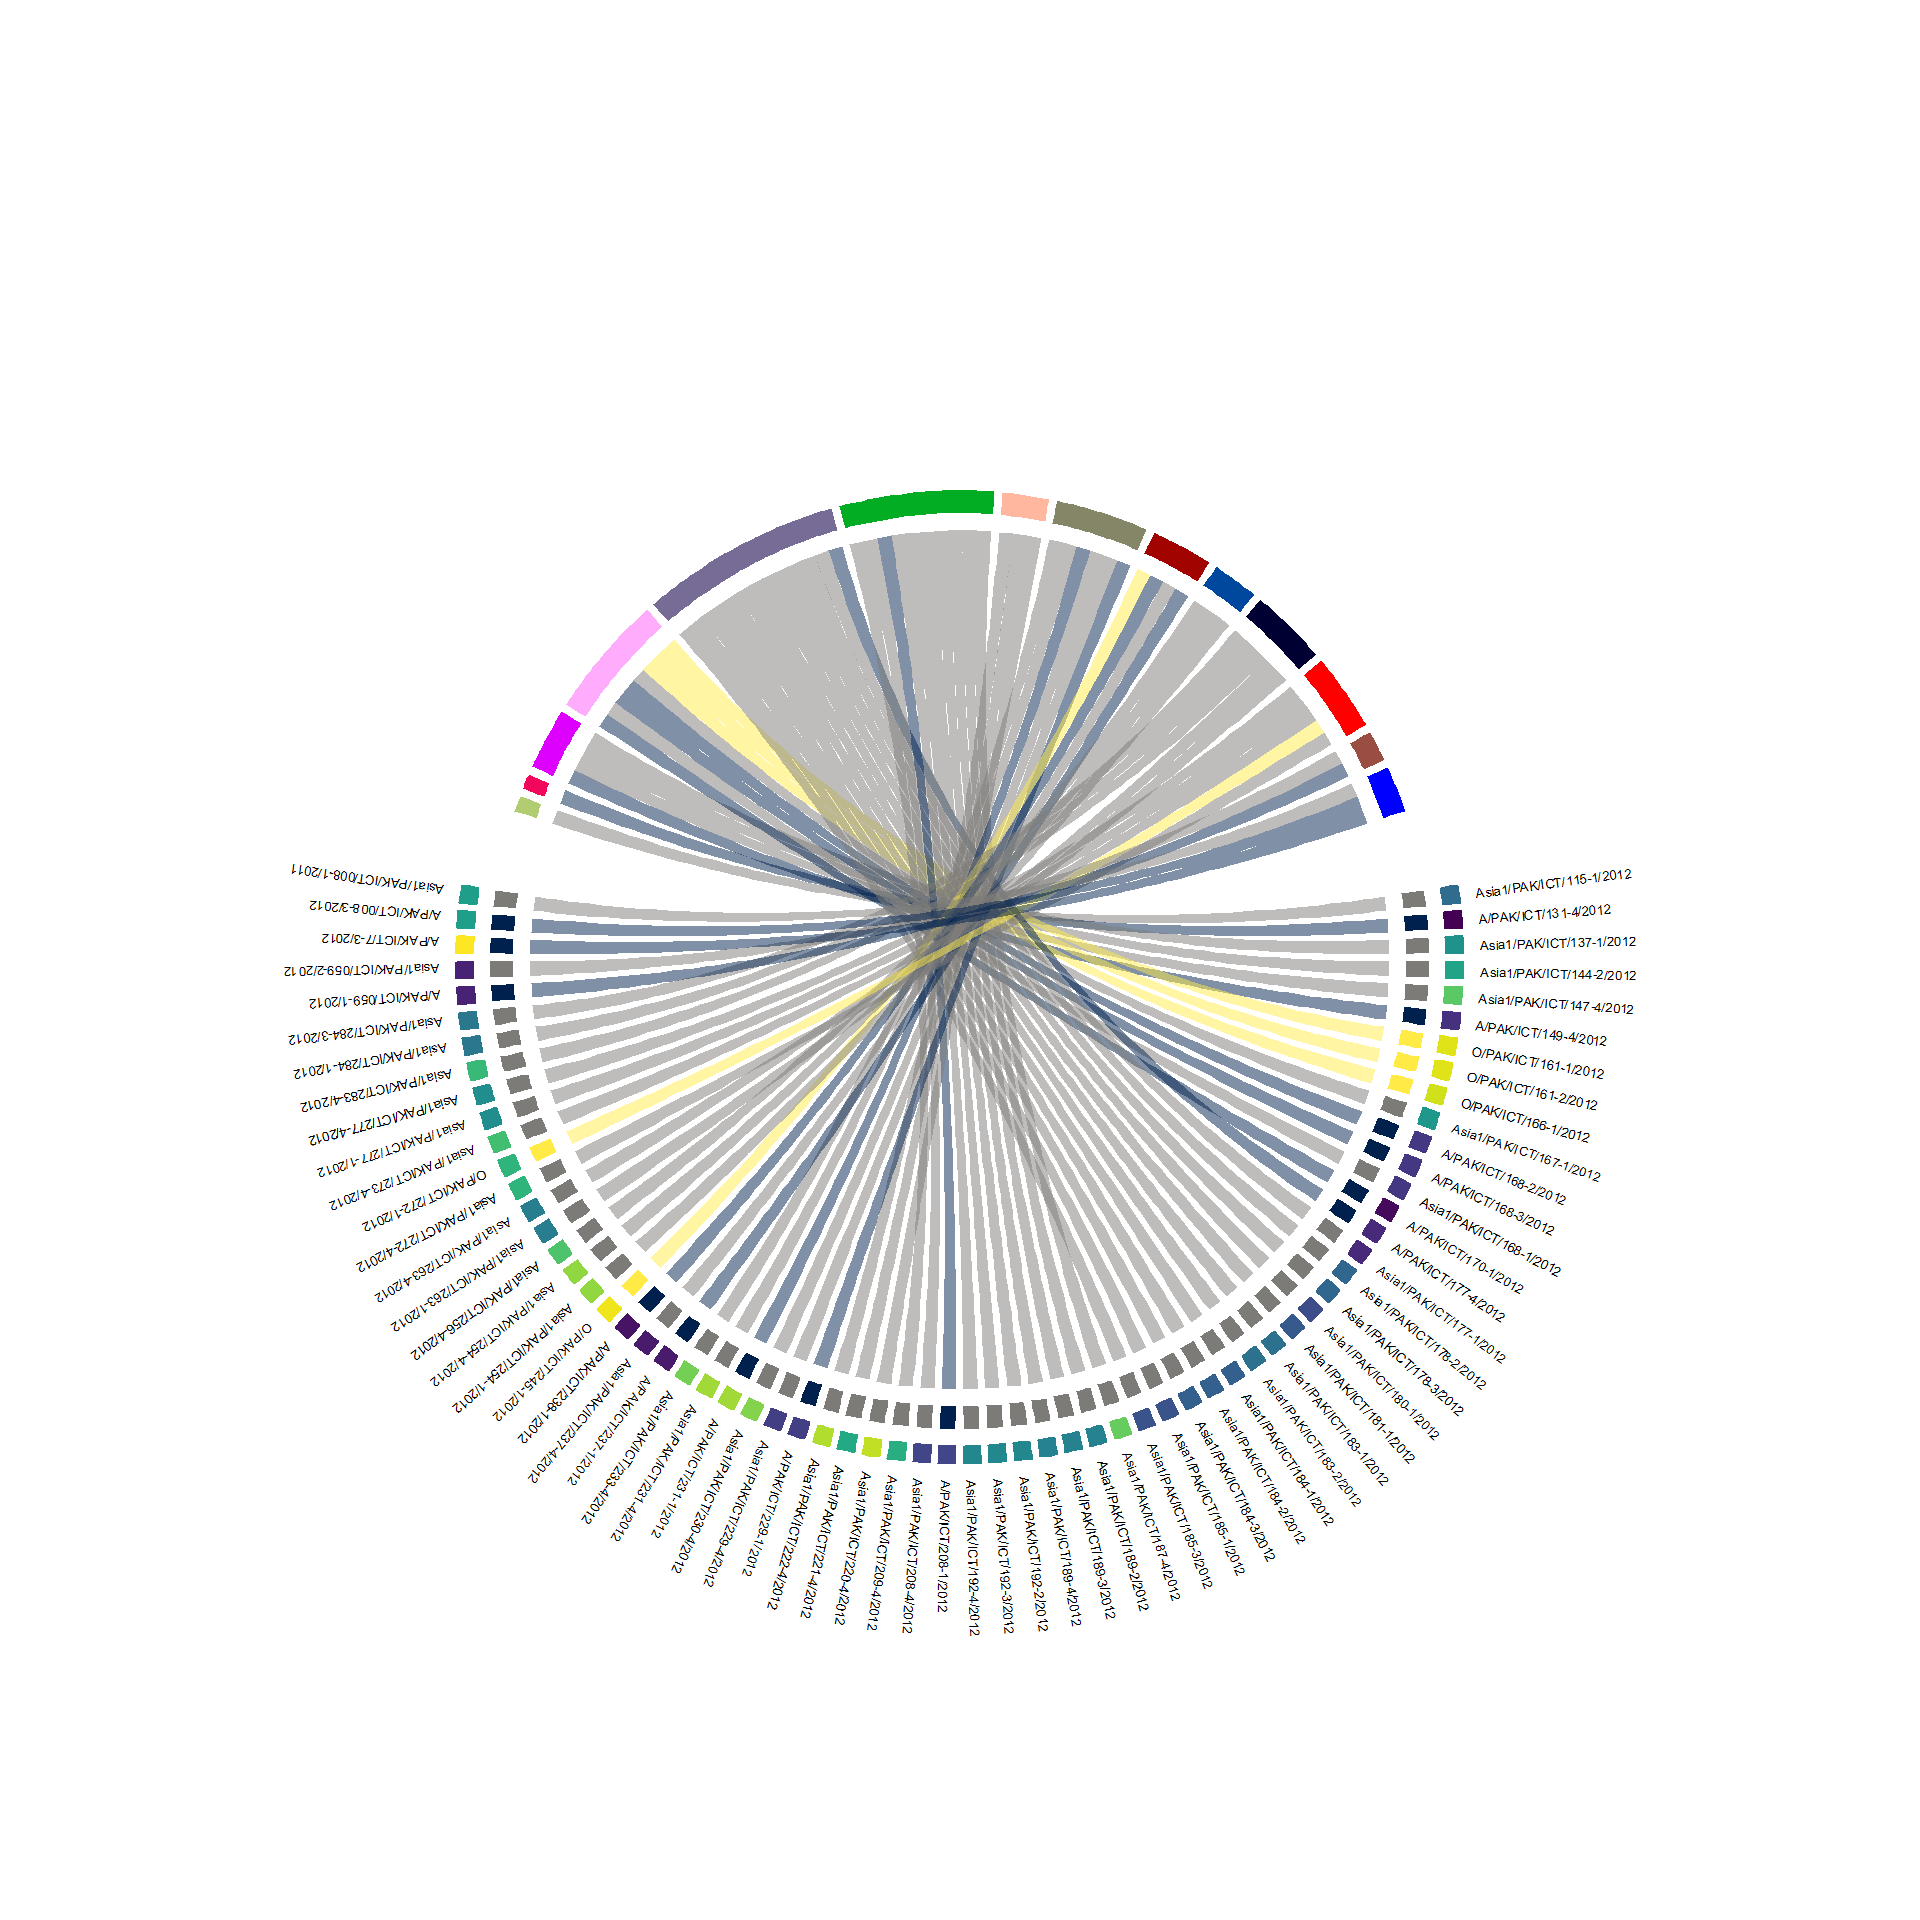
Segments
Post analysis visualizations of segment phylogenies.
Map API
Hide code
# api to access background maps
map_api <- yaml::read_yaml(here("local", "secrets.yaml"))
register_stadiamaps(key = map_api$stadi_api)
has_stadiamaps_key()
[1] TRUERead Gene Trees
Segment specific phylogenies.
Hide code
# divergence time (capsid)
sero_A.tree <- read.nexus(here("local/beast/a_1/sero_a.mcc.tre"))
sero_Asia1.tree <- read.nexus(here("local/beast/asia1_1/sero_asia1.mcc.tre"))
sero_O.tree <- read.nexus(here("local/beast/o_1/sero_o.mcc.tre"))

# phylogeny list from directory
tree_files <- list.files(here("local/paktrees/original"), pattern="_rev\\.nex$")

# read ML trees
seg_A_capsid.tree <- read.nexus(here("local/paktrees/original", tree_files[6]))
seg_Asia1_capsid.tree <- read.nexus(here("local/paktrees/original", tree_files[7]))
seg_O_capsid.tree <- read.nexus(here("local/paktrees/original", tree_files[9]))
IRES_Lpro.tree <- read.nexus(here("local/paktrees/original", tree_files[8]))
seg_2C.tree <- read.nexus(here("local/paktrees/original", tree_files[1]))
seg_3A.tree <- read.nexus(here("local/paktrees/original", tree_files[2]))
seg_3C.tree <- read.nexus(here("local/paktrees/original", tree_files[3]))
seg_3D.tree <- read.nexus(here("local/paktrees/original", tree_files[4]))

# gene trees
gene_trees.lst <- list(
  seg_A = seg_A_capsid.tree,
  seg_Asia1 = seg_Asia1_capsid.tree,
  seg_O = seg_O_capsid.tree,
  IRES_Lpro = IRES_Lpro.tree,
  segment_2C = seg_2C.tree,
  segment_3A = seg_3A.tree,
  segment_3C = seg_3C.tree,
  segment_3D = seg_3D.tree
)
Metadata
Tree metadata on farm locations and sample processing.
Hide code
# sample Metadata
sero_meta <- readRDS(here("local/assets/sero_df.rds"))

sero_meta %>%
  group_by(status) %>%
summarise(Count = length(status))| status | Count |
|---|---|
| Clinical | 46 |
| Subclinical | 68 |
Hide code
# farm Coordinates
farm_coords <- read.csv(here("local/farms_locs.csv")) %>%
  select(farm_code, coord_x, coord_y)
Subclinical Samples
Preclinical samples are of greatest interest.
Hide code
subclinical_df <- sero_meta %>%
  filter(status == "Subclinical")

dim(subclinical_df)
[1] 68 8Hide code
sub_trees.lst <- lapply(gene_trees.lst, function(tree) {
  tips_to_keep <- subclinical_df$label
  drop.tip(tree, setdiff(tree$tip.label, tips_to_keep))
})

names(sub_trees.lst) <- names(gene_trees.lst)

short_sub_trees.lst <- sub_trees.lst[!(names(sub_trees.lst) %in%
                                         c("seg_A", "seg_Asia1", "seg_O"))]
RF Distances
A tree comparison metric. As with entanglement, the lower thhe values, the more similiar the trees.
Hide code
rf_matrix <- sapply(short_sub_trees.lst, function(tree1) {
  sapply(short_sub_trees.lst, function(tree2) {
    phangorn::path.dist(tree1, tree2)
  })
})

rf_df <- as.data.frame(as.table(as.matrix(rf_matrix)))

rf_df$Var1 <- gsub("segment_", " ", rf_df$Var1)
rf_df$Var1 <- gsub("_", " ", rf_df$Var1)

rf_df$Var2 <- gsub("segment_", " ", rf_df$Var2)
rf_df$Var2 <- gsub("_", " ", rf_df$Var2)

ggplot(rf_df, aes(Var1, Var2, fill = Freq)) +
  geom_tile() +
  scale_fill_gradientn(
    colors = rev(pals::ocean.amp(100)[1:80])
  ) +
  theme_classic() +
  theme(
    plot.margin = unit(c(2, 2, 2, 2), "mm"),
    axis.title.x = element_text(size = 24, face = "bold"),
    axis.title.y = element_text(size = 24, face = "bold"),
    axis.text.x = element_text(size = 23, face = "bold"),
    axis.text.y = element_text(size = 23, face = "bold"),
    legend.direction = "vertical",
    legend.position = "right",
    strip.text = element_blank(),
    strip.background = element_blank(),
    legend.key.size = unit(2, "line"),
    legend.key.width = unit(1, "line"),
    legend.text = element_text(size = 20, face = "bold"),
    legend.title = element_text(size = 25, face = "bold"),
    plot.title = element_text(size = 28, face = "bold")
  ) +
  labs(title = "Robinson-Foulds Distance",
       x = " ", y = " ", fill = "RF Distance")
Map and Tree
Comparing locations. Working out the map code…
Hide code
# Load the Tree
sero_O.tree <- read.nexus(here("local/beast/o_1/sero_o.mcc.tre"))
sero_O.tree <- drop.tip(sero_O.tree, tip = c("JX170756", "KR149704", "MT944981"))

# tree stats
check_stats_O <- get_tracer_stats(here("local/beast/o_1/sero_o.log.txt"))
Loading required package: codaHide code
# tips to data frame
tree_meta_O <- as.data.frame(sero_O.tree$tip.label)
names(tree_meta_O) <- "tip_label"

# metadata and exclude outgroups
sero_meta_filtered <- sero_meta %>%
  mutate(tip_label = label) %>%
  filter(tip_label %in% sero_O.tree$tip.label,
         !tip_label %in% c("JX170756", "KR149704", "MT944981"))

# combine metadata
farm_data <- farm_coords %>%
  left_join(sero_meta_filtered, by = "farm_code") %>%
  mutate(has_sample = !is.na(tip_label))

# color palette for farm_code
farm_color_codes <- unique(farm_data$farm_code)
n_farms <- length(farm_color_codes)
farm_palette <- setNames(glasbey(n_farms), farm_color_codes)

farm_match <- farm_data %>%
  select(tip_label, farm_code)

# Merge Tree Metadata with Farm Data
tree_meta_O <- tree_meta_O %>%
  left_join(farm_data, by = "tip_label") %>%
  mutate(
    farm_code = ifelse(is.na(farm_code), "Outgroup", farm_code),
    has_sample = !is.na(farm_code) & farm_code != "Outgroup"
  )

tree_meta_O <- tree_meta_O %>%
  rename(tip_label_meta = label) %>%
  rename(label = tip_label)

# to sf Object
farms_sf <- st_as_sf(farm_data, coords = c("coord_y", "coord_x"), crs = 4326)

tree_plot <- plot_time_tree_map(sero_O.tree, check_stats_O, tree_meta_O)
Hide code
tree_plot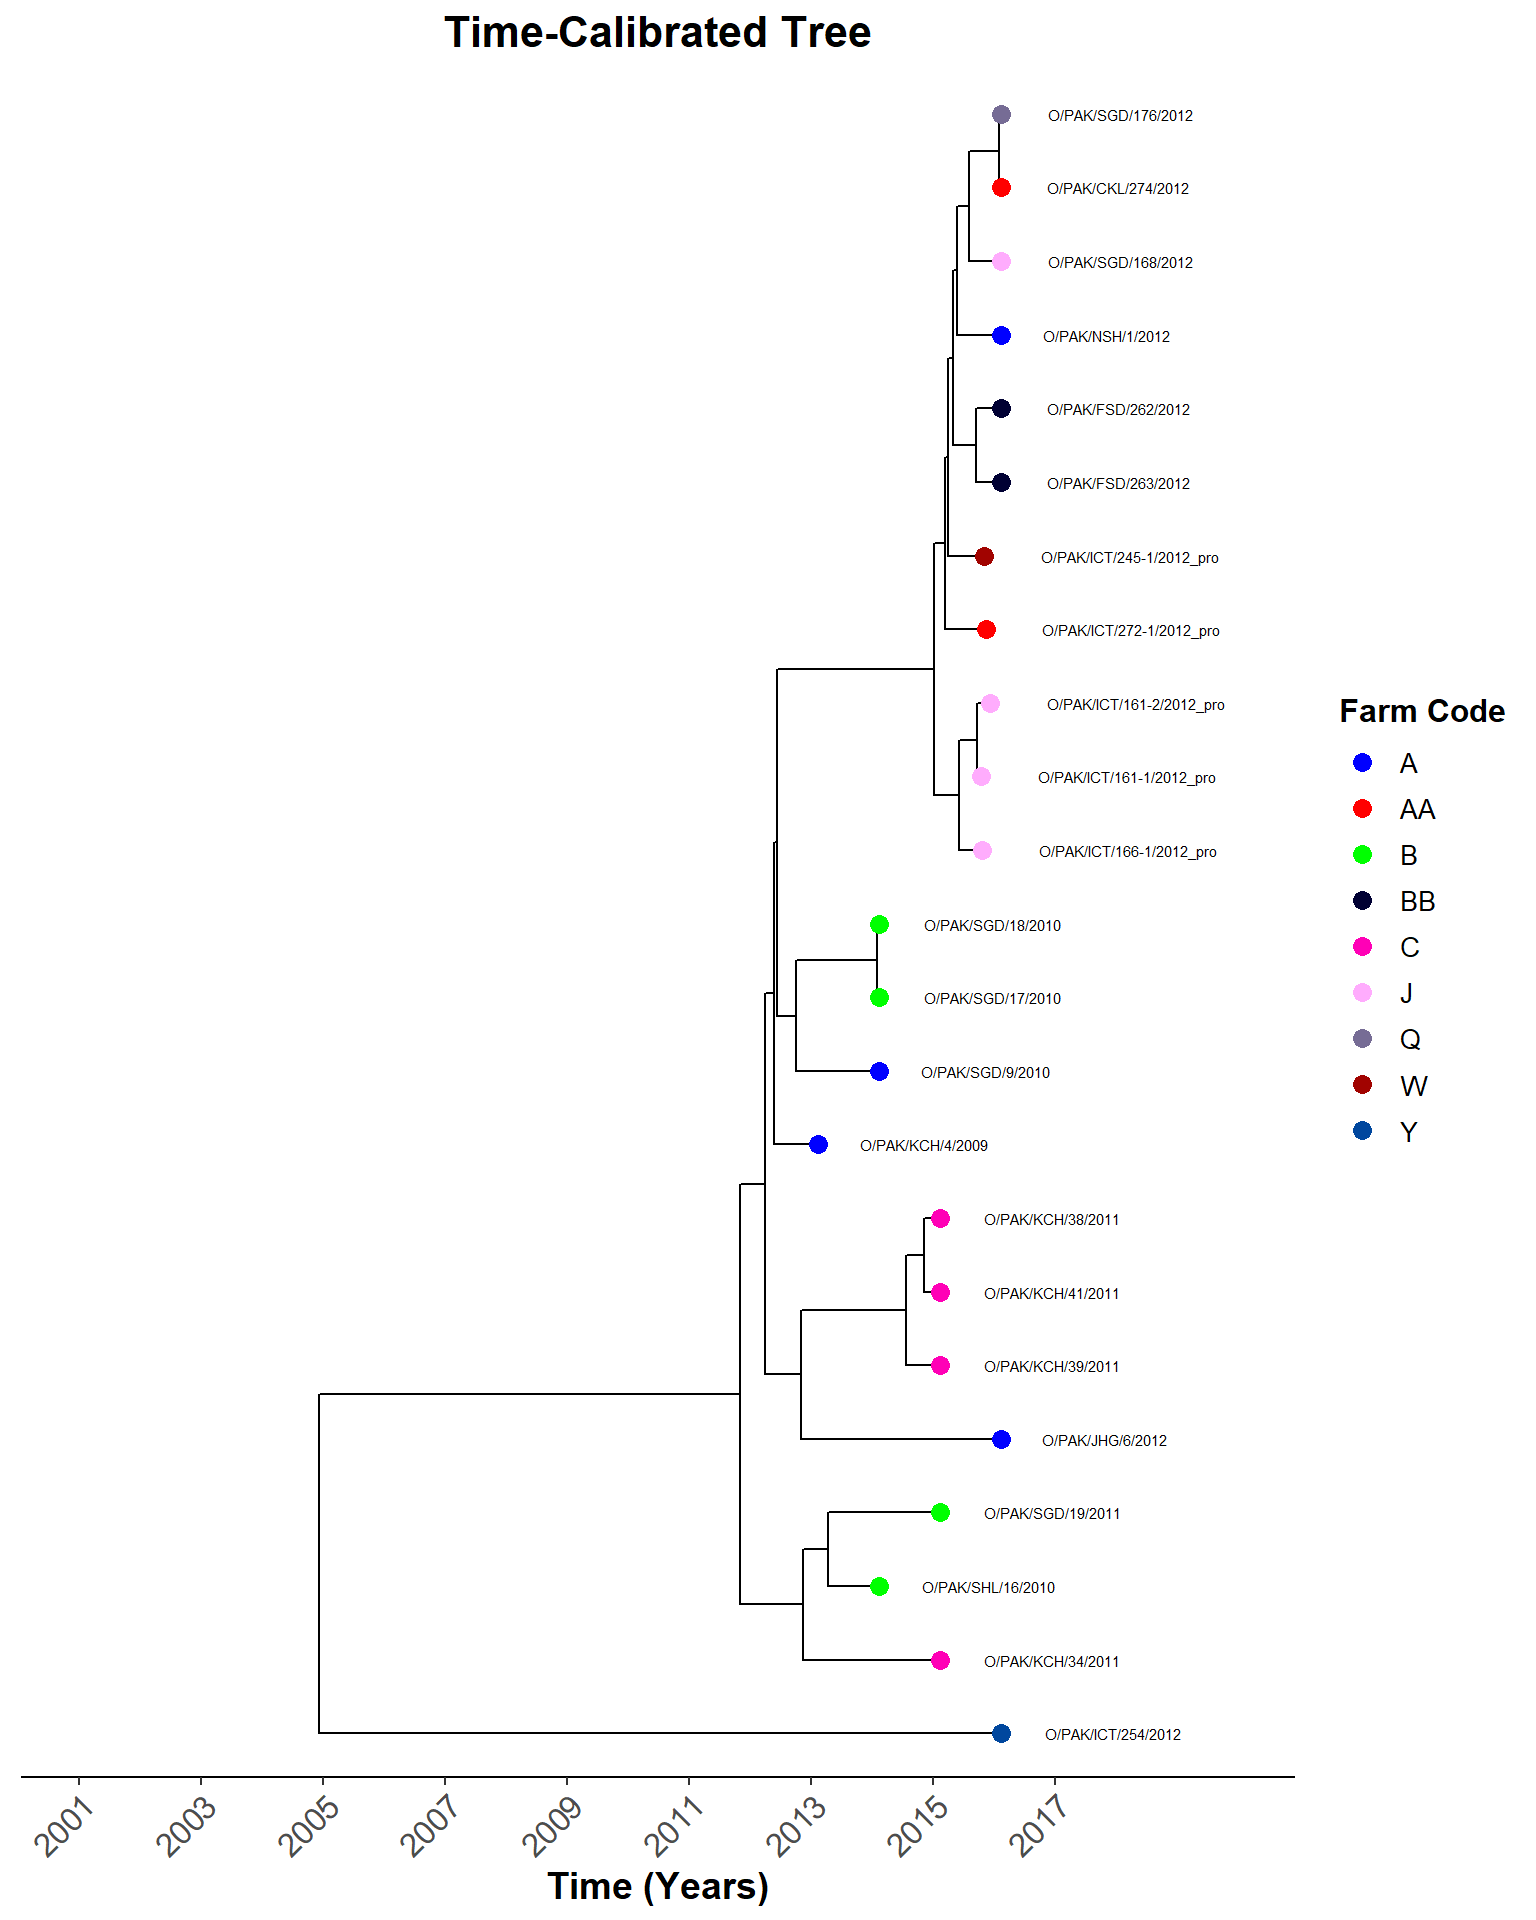
Oragianize map data.
Hide code
# seed
set.seed(1976)
farms_sf_jitter <- farms_sf %>%
  mutate(
    x = st_coordinates(.)[, 1],
    y = st_coordinates(.)[, 2]
  )

buffer_set <- farm_coords %>%
  mutate(temp_x = coord_x) %>%
  select(-coord_x) %>%
  mutate(
    coord_y = coord_y,
    coord_x = temp_x
  ) %>%
  select(-temp_x)

bbox <- calculate_bounding_box(buffer_set, 1)

bbox_coords <- c(left = bbox$min_lon, bottom = bbox$min_lat,
                 right = bbox$max_lon, top = bbox$max_lat)

background_map <- get_map(location = bbox_coords,
                          source = "stadia", maptype = "stamen_toner_lite")
ℹ © Stadia Maps © Stamen Design © OpenMapTiles © OpenStreetMap contributors.Hide code
map_plot <- ggmap(background_map) +
  geom_sf(data = farms_sf_jitter %>% filter(!has_sample),
          fill = "gray50", color = "gray50", size = 3, shape = 21, inherit.aes = FALSE) +
  geom_sf(data = farms_sf_jitter %>% filter(has_sample),
          aes(fill = farm_code), size = 3, shape = 21, color = "transparent",
          inherit.aes = FALSE) +
  geom_jitter(
    data = farms_sf_jitter %>% filter(has_sample),
    aes(x = x, y = y, fill = farm_code),
    size = 3, shape = 21, color = "transparent", width = 0.001, height = 0.001
  ) +
  scale_fill_manual(values = farm_palette) +
  theme_classic() +
  theme(
    plot.margin = unit(c(2, 8, 5, 8), "mm"),
    axis.title.x = element_text(size = 24, face = "bold"),
    axis.title.y = element_text(size = 24, face = "bold"),
    axis.text.x = element_text(size = 12, face = "bold"),
    axis.text.y = element_text(size = 12, face = "bold"),
    legend.direction = "vertical",
    legend.position = "right",
    strip.text = element_blank(),
    strip.background = element_blank(),
    legend.key.size = unit(2, "line"),
    legend.key.width = unit(3, "line"),
    legend.text = element_text(size = 16, face = "bold"),
    legend.title = element_text(size = 16, face = "bold"),
    plot.title = element_text(size = 28, face = "bold")
  ) +
  labs(title = "Farm Locations", fill = "Farm Code",
       x = "Longitude", y = "Latitude") +
  annotation_scale(location = "tl", width_hint = 0.4) +
  coord_sf(crs = 4326)
Coordinate system already present. Adding new coordinate system, which will
replace the existing one.Hide code
map_plot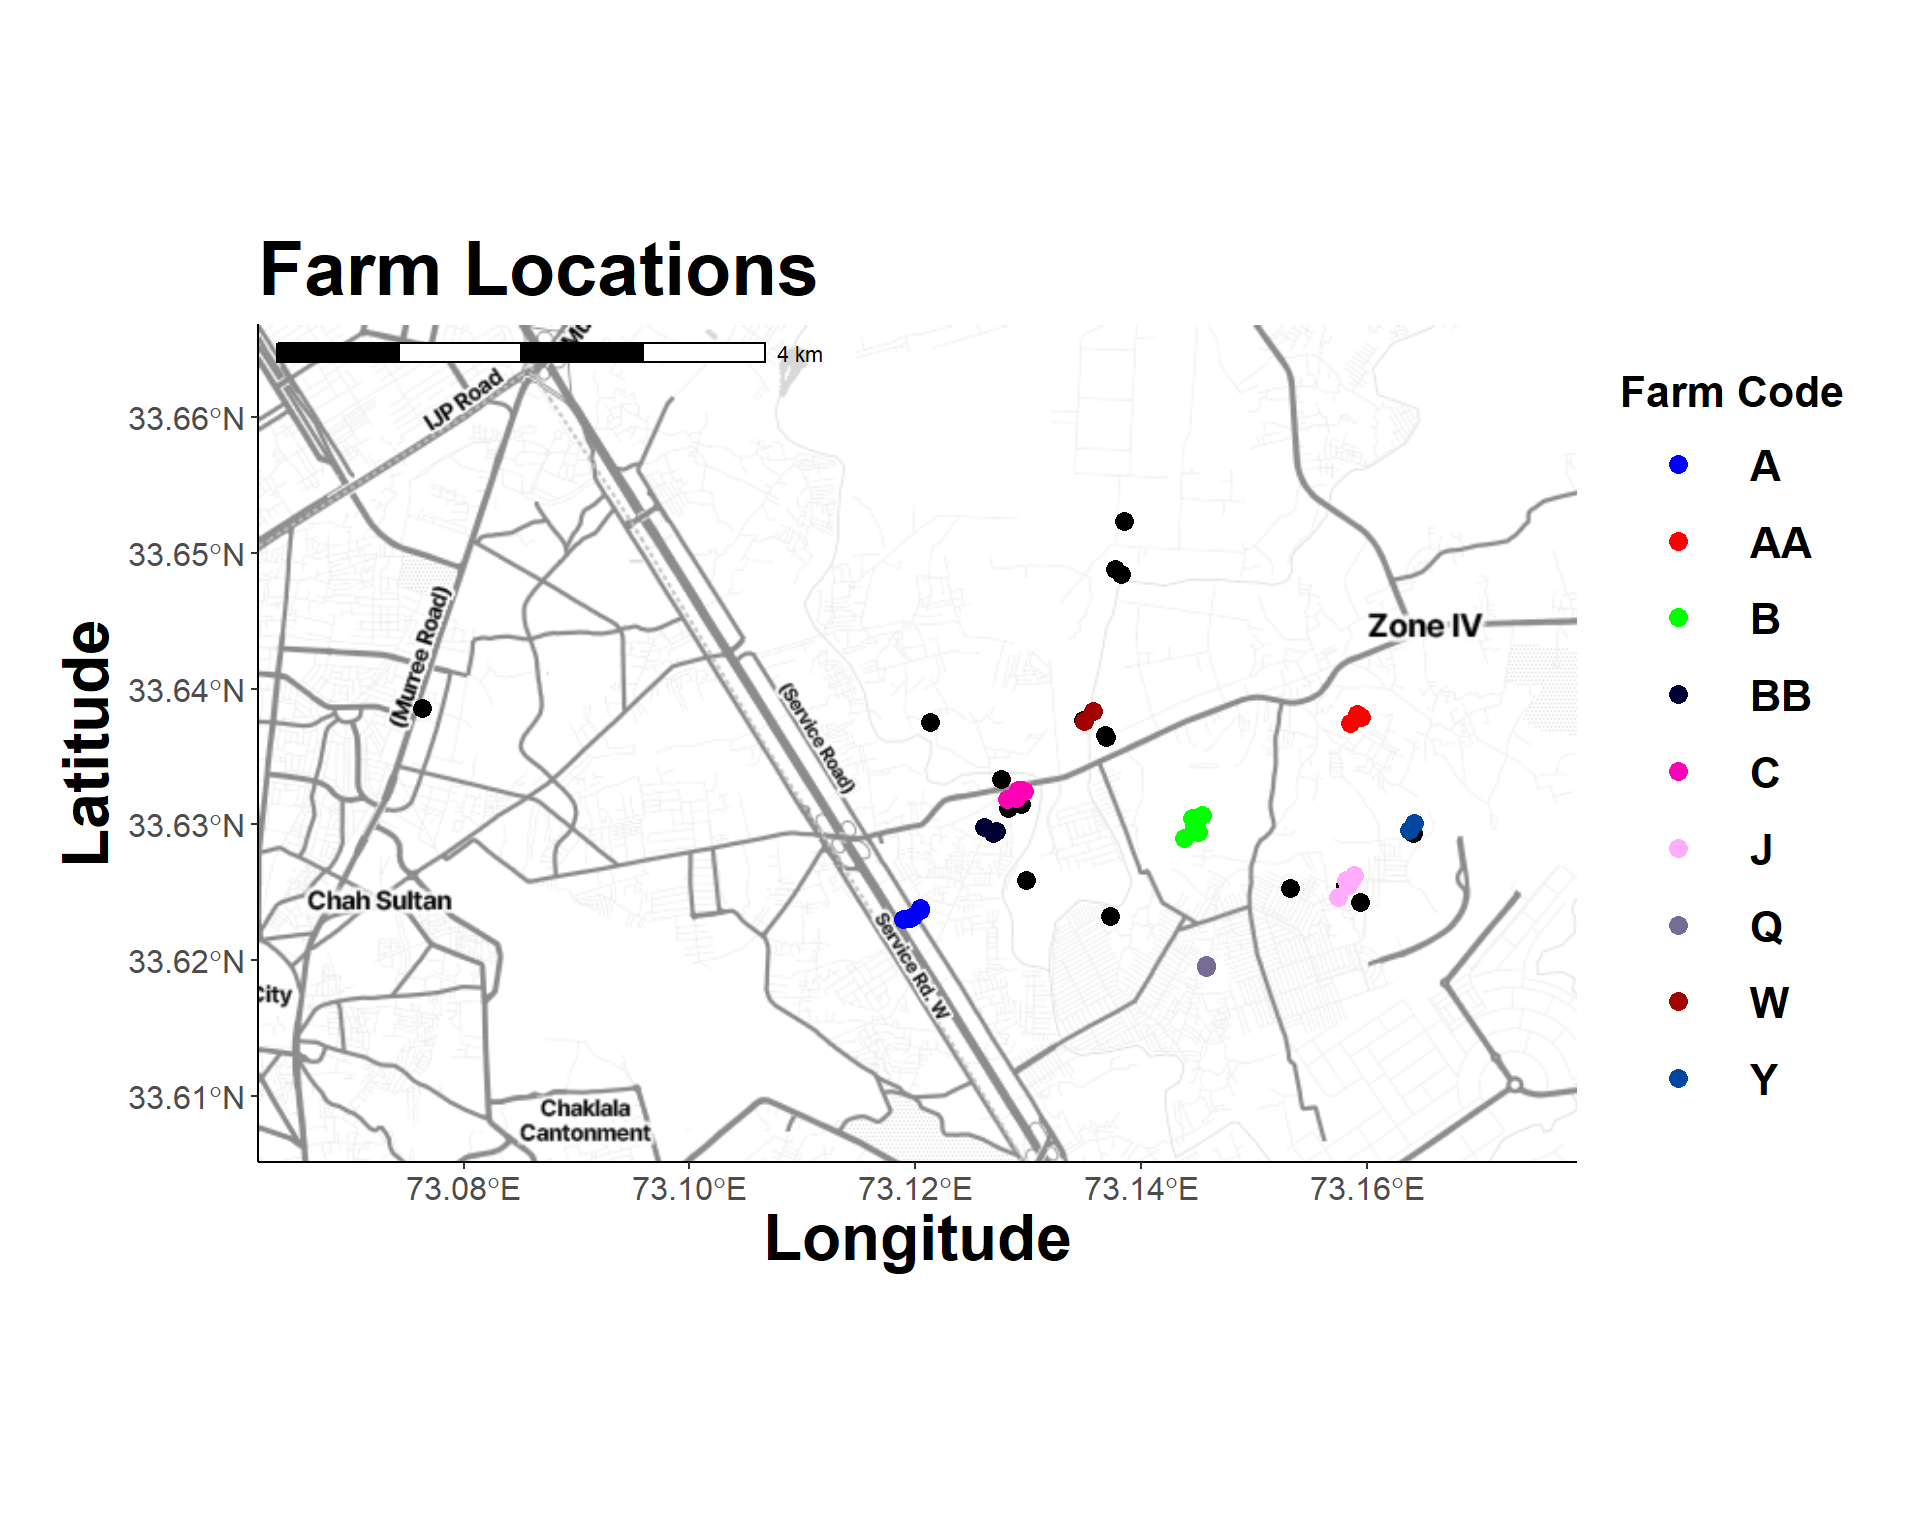
Hide code
combined_plot <- tree_plot / map_plot +
  plot_layout(heights = c(2, 2))

combined_plot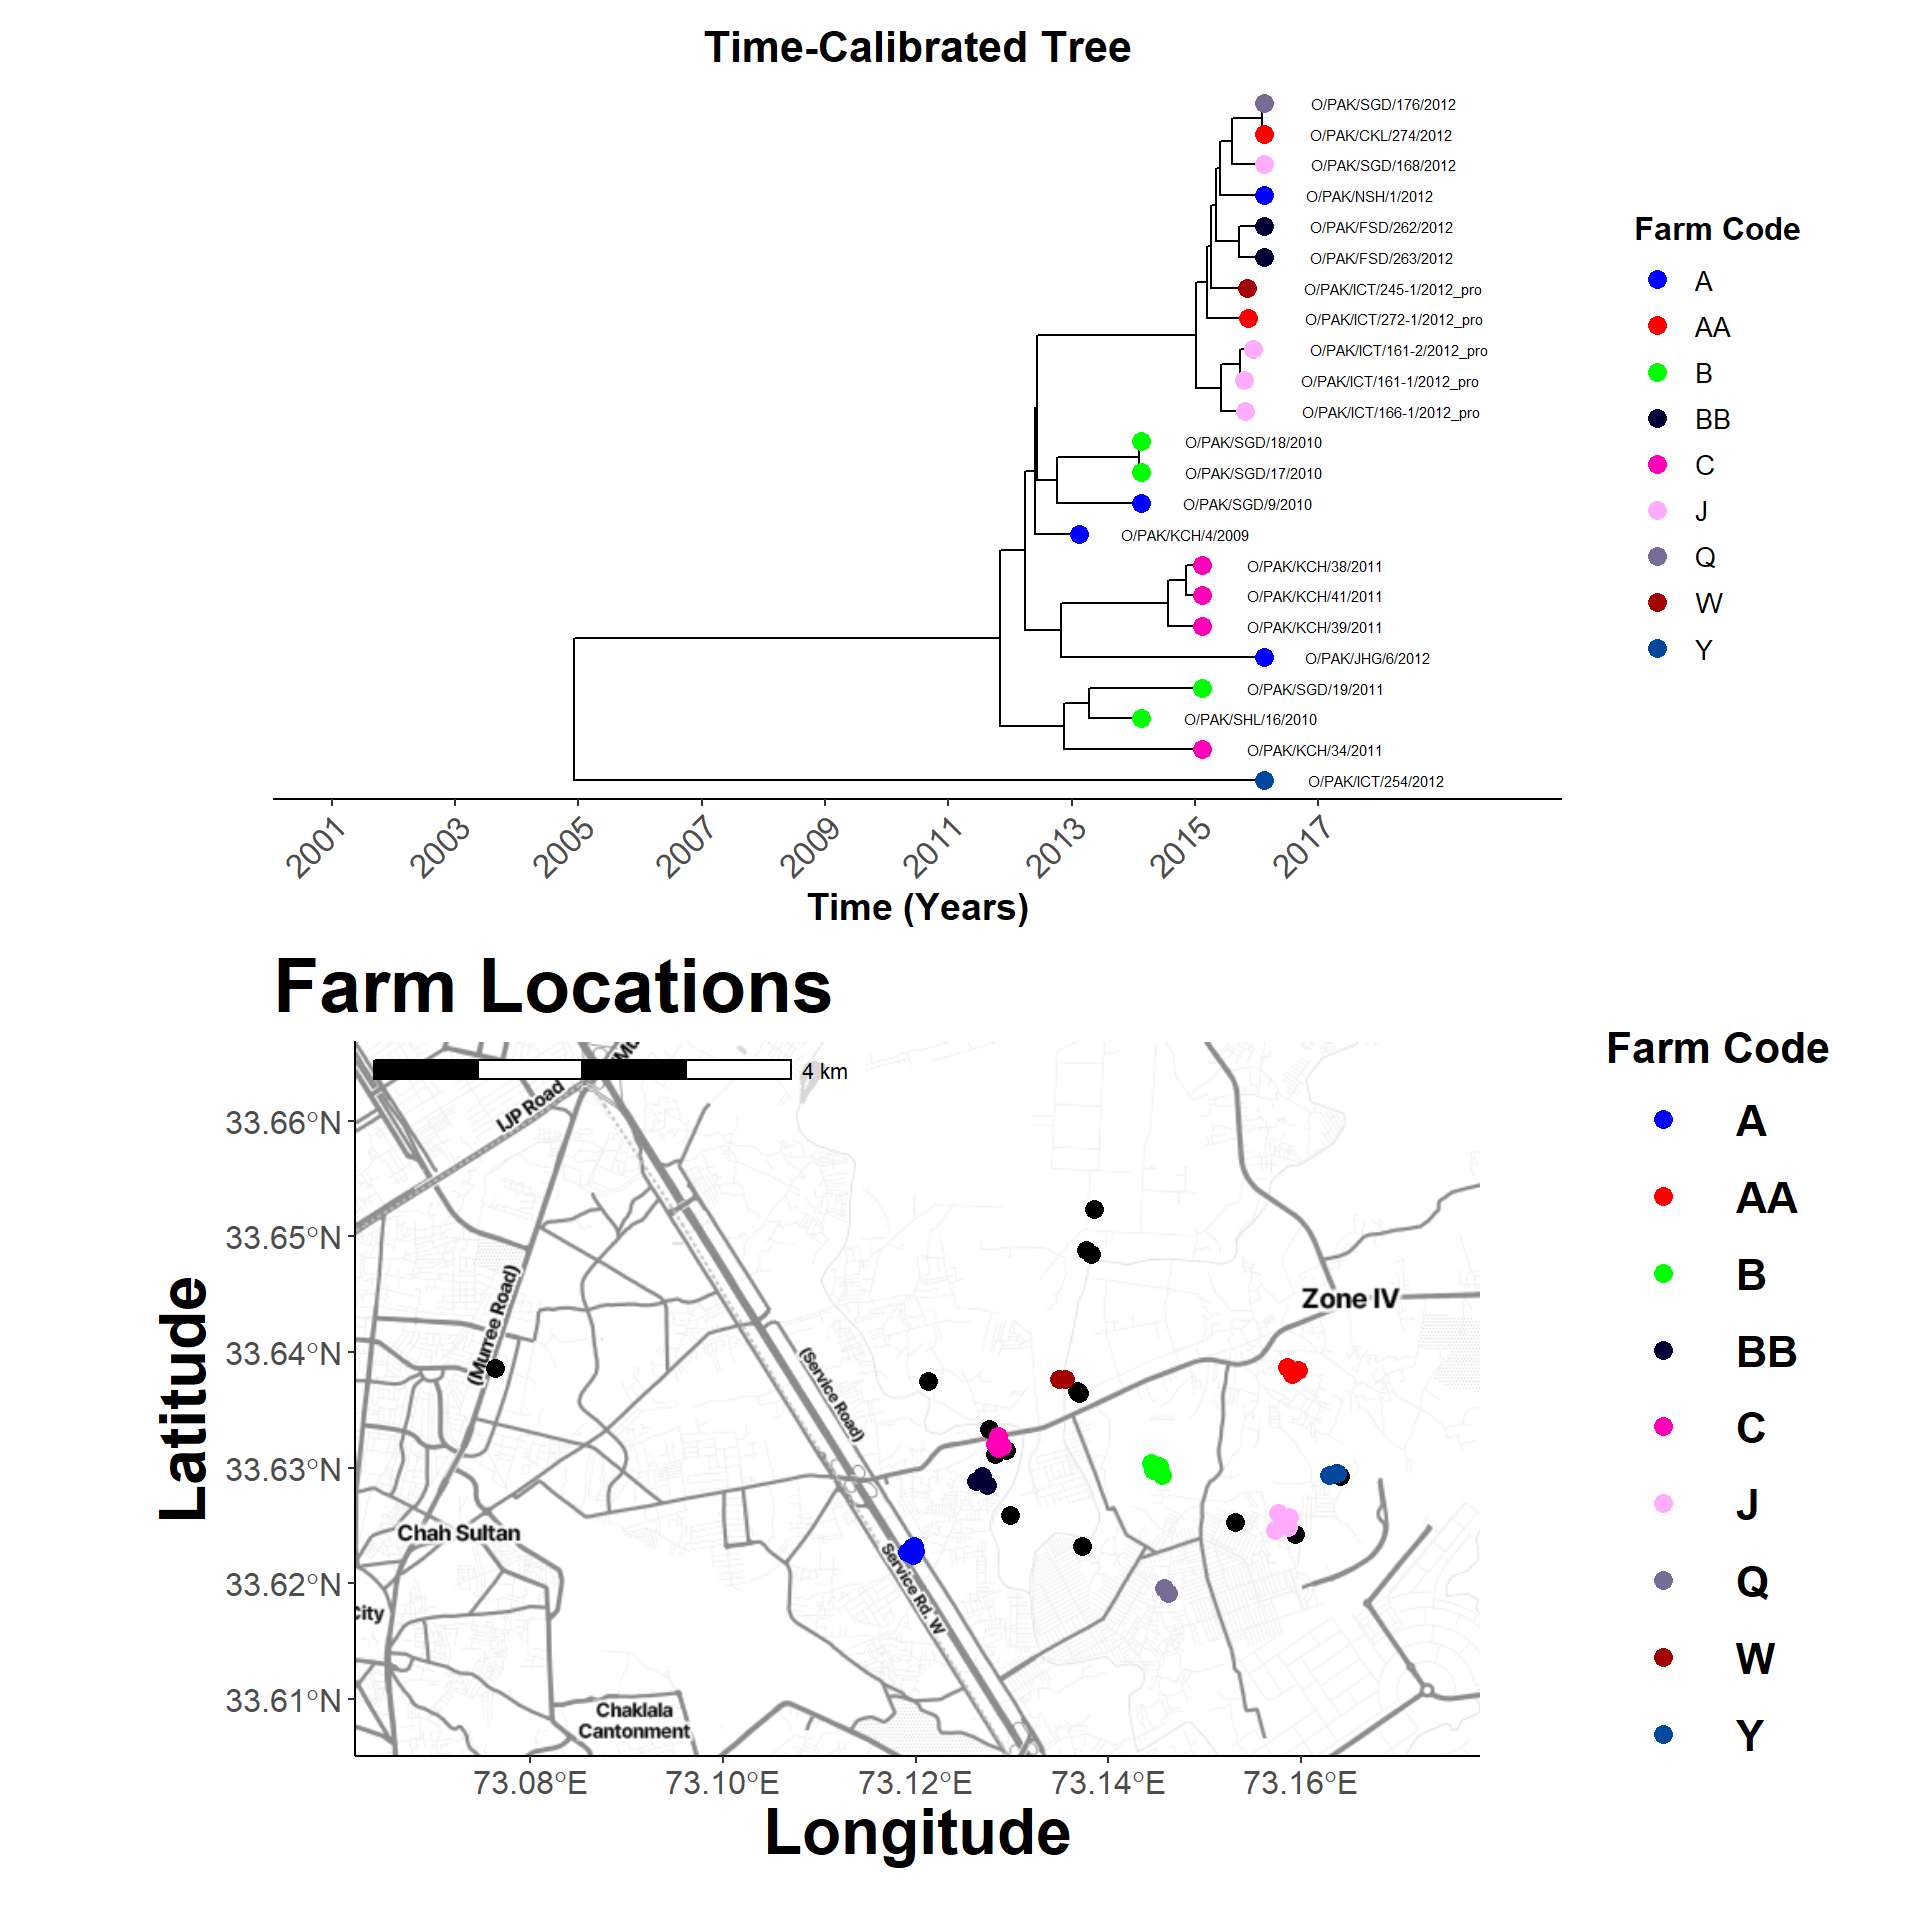
Segment Trees
View trees in panel.
Hide code
plot_tree <- function(tree, metadata, title) {
  p <- ggtree(tree, branch.length='none', layout='circular') %<+% metadata +
    geom_tippoint(data = ~subset(., !is.na(farm_code) & farm_code != "NA"),
              aes(color = farm_code, shape = serotype), size = 2) +
    scale_color_manual(values = farm_palette) +
    scale_shape_manual(values = c("A" = 15, "Asia1" = 16, "O" = 17)) +
    ggtitle(title) +
    theme(#plot.title = element_blank,
          plot.title = element_text(hjust = 0.5),
          legend.position = "none")

  return(p)
}


length(unique(subclinical_df$farm_code))
[1] 18Hide code
# individual plots
gene_plots <- lapply(names(sub_trees.lst), function(name) {
  plot_tree(sub_trees.lst[[name]], subclinical_df, title = name)
})
Hide code
combined_plot <- wrap_plots(gene_plots, ncol = 4)
combined_plot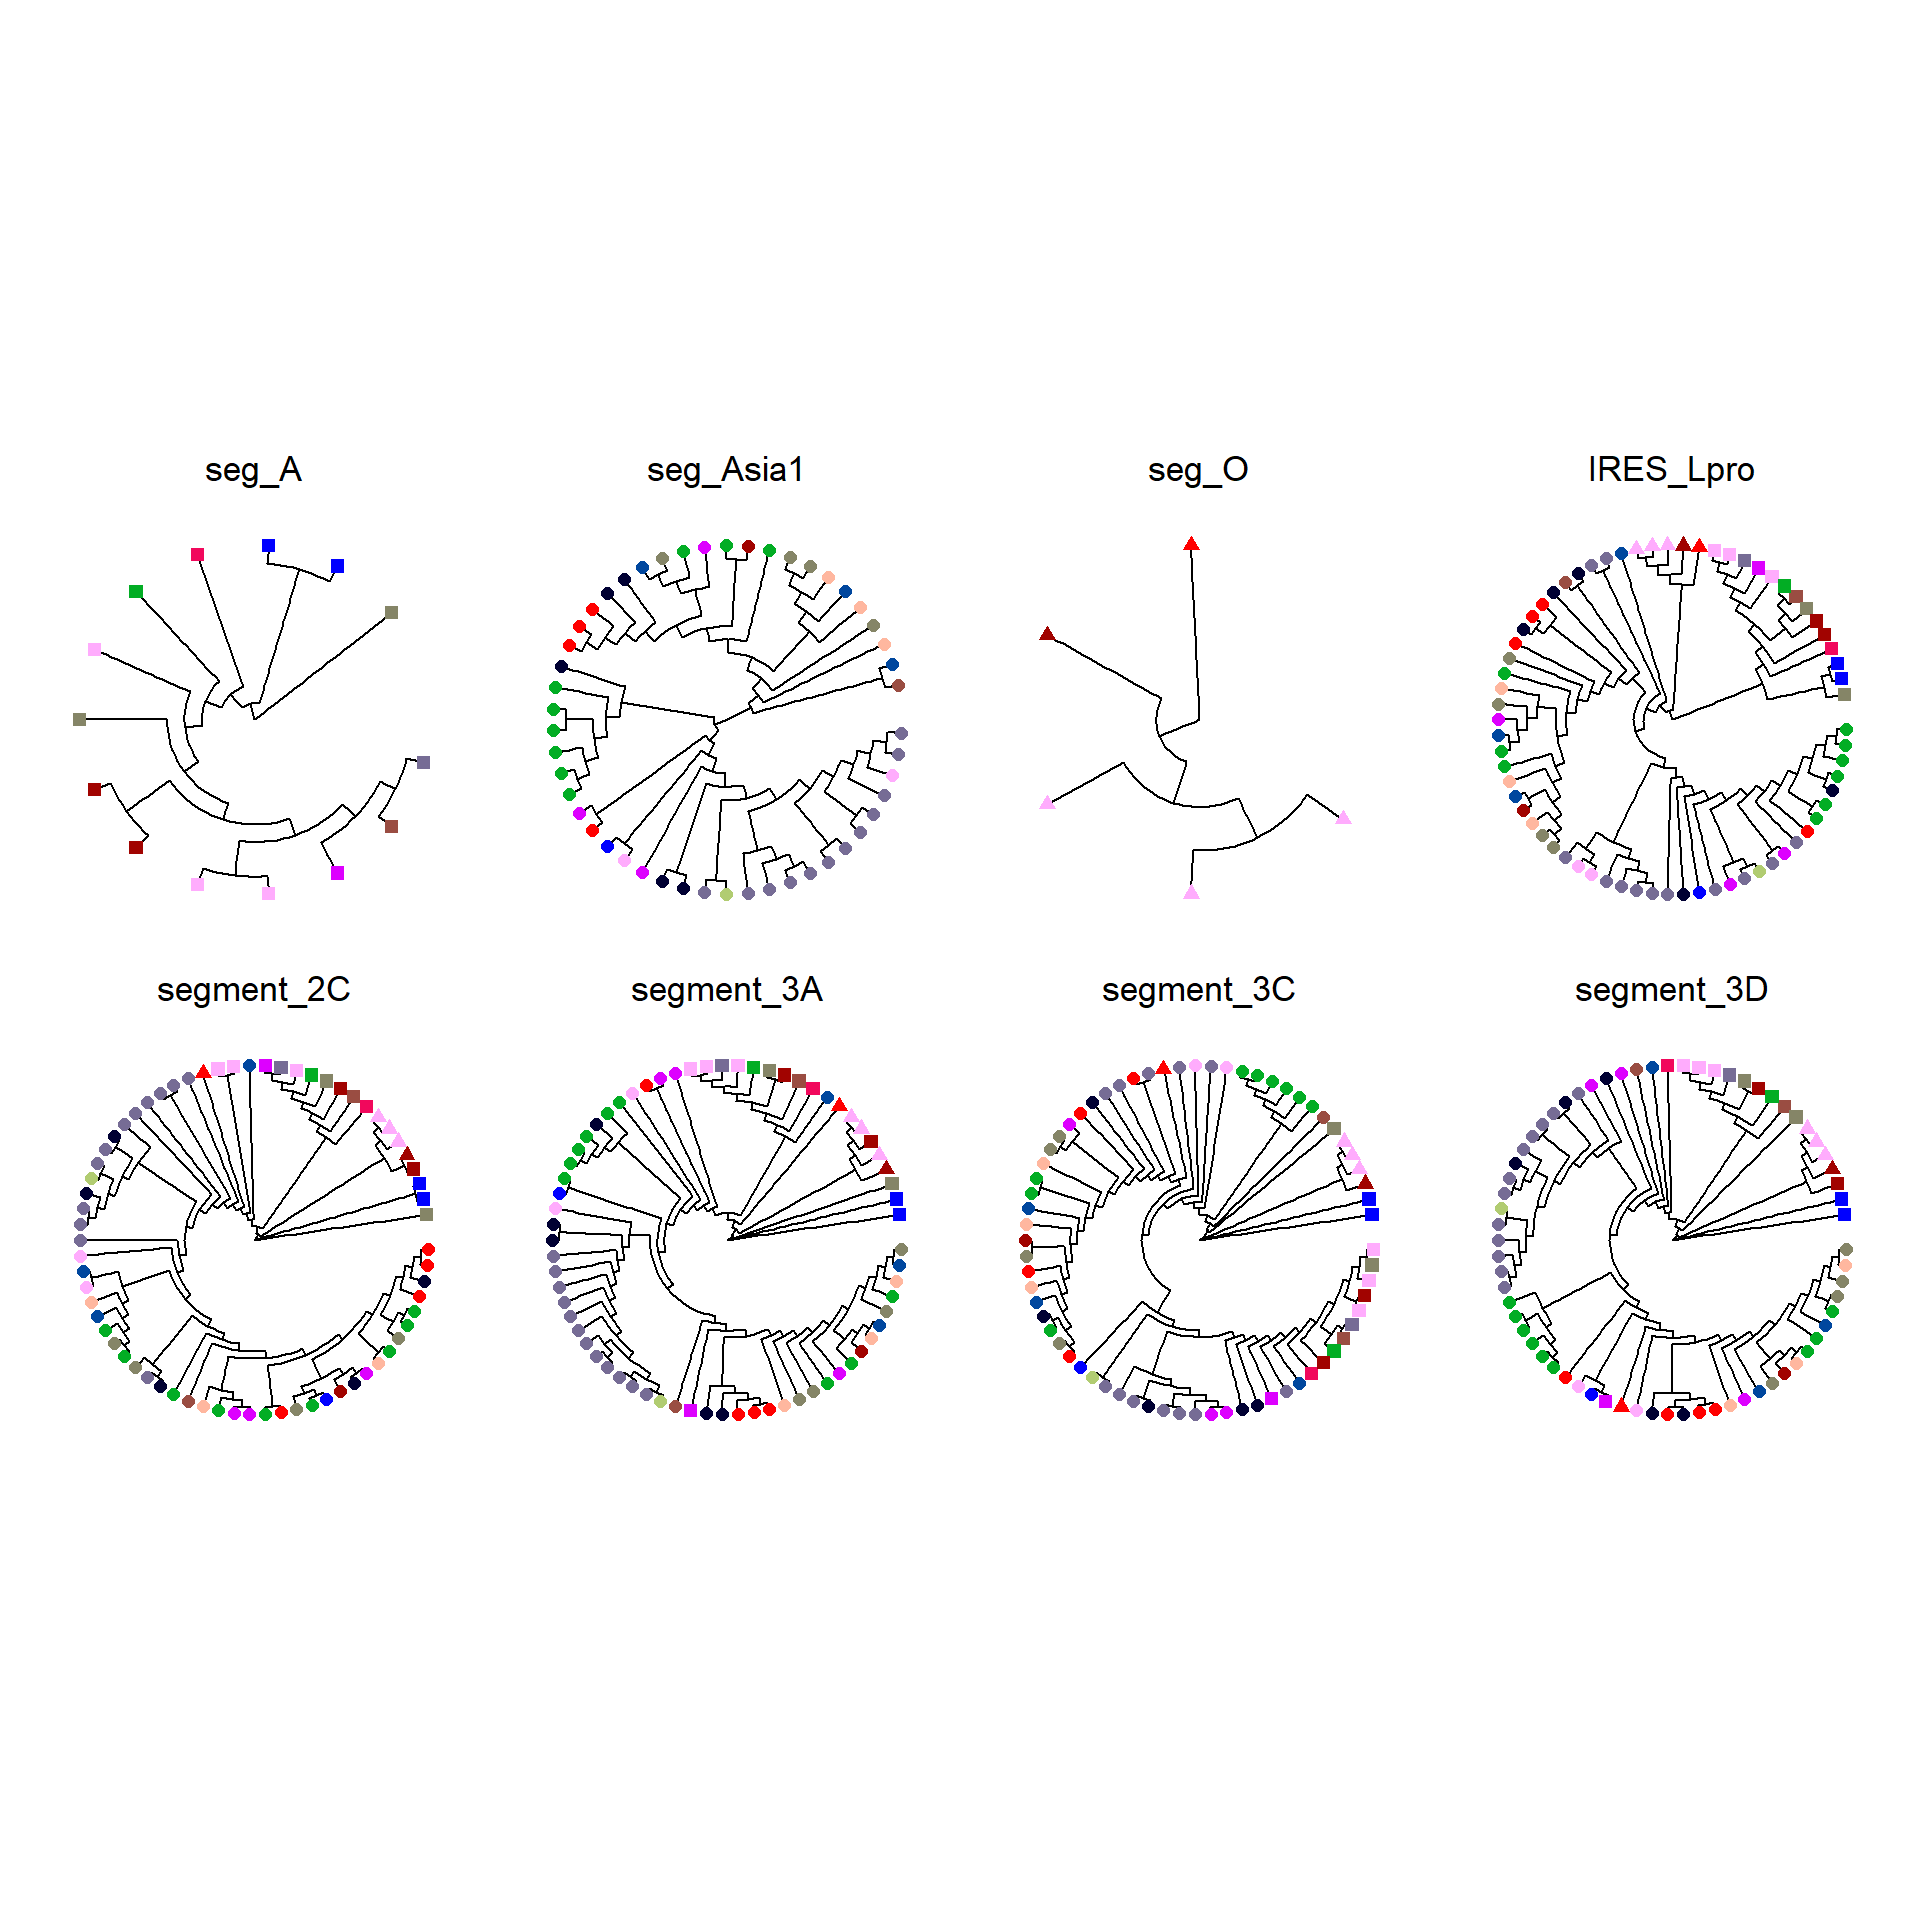
Chord Diagram
Hide code
links_df <- do.call(rbind, lapply(names(short_sub_trees.lst), function(gene) {
  tree <- short_sub_trees.lst[[gene]]
  subclinical_df %>%
    filter(label %in% tree$tip.label) %>%
    mutate(gene = gene,
           label = gsub("_pro", "", label),
           animal= paste0("samp_", animal)) %>%
    select(label, farm_code, serotype, animal, gene)
}))


serotype_palette <- setNames(viridis(3, option = "E"), unique(links_df$serotype))

animal_palette <- setNames(viridis(length(unique(links_df$animal)),
                                   option = "D"), unique(links_df$animal))
Hide code
plot_chords("IRES_Lpro", links_df, serotype_palette, farm_palette, animal_palette)