Code
detect_summary <- summarize_detections(detection)summarize_detections() returns a summary of detection events by iteration.
detect_summary <- summarize_detections(detection)View a subset of detect_summary
## Filter data to scenario
detect_summary_select <- detect_summary %>%
  filter(region == "central") %>%
  filter(scenario_type == "suboptimal") %>%
  filter(preclinical == 2)

## Select and order columns to display
detect_summary_select <- detect_summary_select[c("iteration", "farms_detected", "first_detect", "last_detect", "duration")]

## Check data
head(detect_summary_select)| iteration | farms_detected | first_detect | last_detect | duration |
|---|---|---|---|---|
| 1 | 82 | 18 | 68 | 50 |
| 2 | 13 | 18 | 36 | 18 |
| 3 | 179 | 18 | 90 | 72 |
| 4 | 10 | 18 | 44 | 26 |
| 5 | 20 | 18 | 49 | 31 |
| 6 | 115 | 18 | 118 | 100 |
generate_detect_statistics() returns summary statistics for each modeling scenario. Results are grouped by region, scenario_type, and preclinical.
detect_config_summary <- generate_detect_statistics(detect_summary)The number of days between the first detection and last detection in a single outbreak
duration_summary <- detect_config_summary %>%
filter(summary == "duration")## Filter to western region
duration_western_summary <- duration_summary %>%
filter(region == "western")
## Select and order columns
duration_western_select <- duration_western_summary[c("scenario_type", "preclinical", "mean", "q05", "q25", "q50", "q75", "q95")]
duration_western_select <- duration_western_select %>%
mutate_if(is.numeric, round, digits = 2)
duration_western_select| scenario_type | preclinical | mean | q05 | q25 | q50 | q75 | q95 |
|---|---|---|---|---|---|---|---|
| optimal | 0 | 19.98 | 2.00 | 5.75 | 15.0 | 28.00 | 54.10 |
| optimal | 1 | 27.47 | 2.00 | 9.00 | 22.0 | 38.00 | 75.00 |
| optimal | 2 | 36.55 | 2.00 | 15.00 | 27.0 | 54.25 | 95.05 |
| optimal | 3 | 43.22 | 6.00 | 18.00 | 36.0 | 63.00 | 99.00 |
| suboptimal | 0 | 52.37 | 12.00 | 27.00 | 46.0 | 70.00 | 118.10 |
| suboptimal | 1 | 67.56 | 12.95 | 37.00 | 64.0 | 91.00 | 135.05 |
| suboptimal | 2 | 80.44 | 17.00 | 46.00 | 73.0 | 107.00 | 172.05 |
| suboptimal | 3 | 99.62 | 29.00 | 63.75 | 93.0 | 124.00 | 200.20 |
| low-virulence | 6 | 262.10 | 93.95 | 204.00 | 285.5 | 341.00 | 341.00 |
## Filter to central region
duration_central_summary <- duration_summary %>%
  filter(region == "central")

## Select and order columns
duration_central_select <- duration_central_summary[c("scenario_type", "preclinical", "mean", "q05", "q25", "q50", "q75", "q95")]

duration_central_select <- duration_central_select %>%
  mutate_if(is.numeric, round, digits = 2)

duration_central_select| scenario_type | preclinical | mean | q05 | q25 | q50 | q75 | q95 |
|---|---|---|---|---|---|---|---|
| optimal | 0 | 15.84 | 2.00 | 2.00 | 13.0 | 22.00 | 45.00 |
| optimal | 1 | 21.95 | 2.00 | 8.00 | 17.0 | 28.00 | 61.00 |
| optimal | 2 | 28.71 | 2.00 | 12.00 | 23.0 | 37.00 | 75.00 |
| optimal | 3 | 44.31 | 6.00 | 15.00 | 28.0 | 59.00 | 135.00 |
| suboptimal | 0 | 48.50 | 10.00 | 24.00 | 38.0 | 65.25 | 124.05 |
| suboptimal | 1 | 67.65 | 14.00 | 28.00 | 53.0 | 93.25 | 181.00 |
| suboptimal | 2 | 90.33 | 15.90 | 34.50 | 71.5 | 141.00 | 213.05 |
| suboptimal | 3 | 119.54 | 17.95 | 48.00 | 108.0 | 189.00 | 243.00 |
| low-virulence | 6 | 308.77 | 212.45 | 291.25 | 340.0 | 341.00 | 341.00 |
## Filter to eastern region
duration_eastern_summary <- duration_summary %>%
  filter(region == "eastern")

## Select and order columns
duration_eastern_select <- duration_eastern_summary[c("scenario_type", "preclinical", "mean", "q05", "q25", "q50", "q75", "q95")]

duration_eastern_select <- duration_eastern_select %>%
  mutate_if(is.numeric, round, digits = 2)
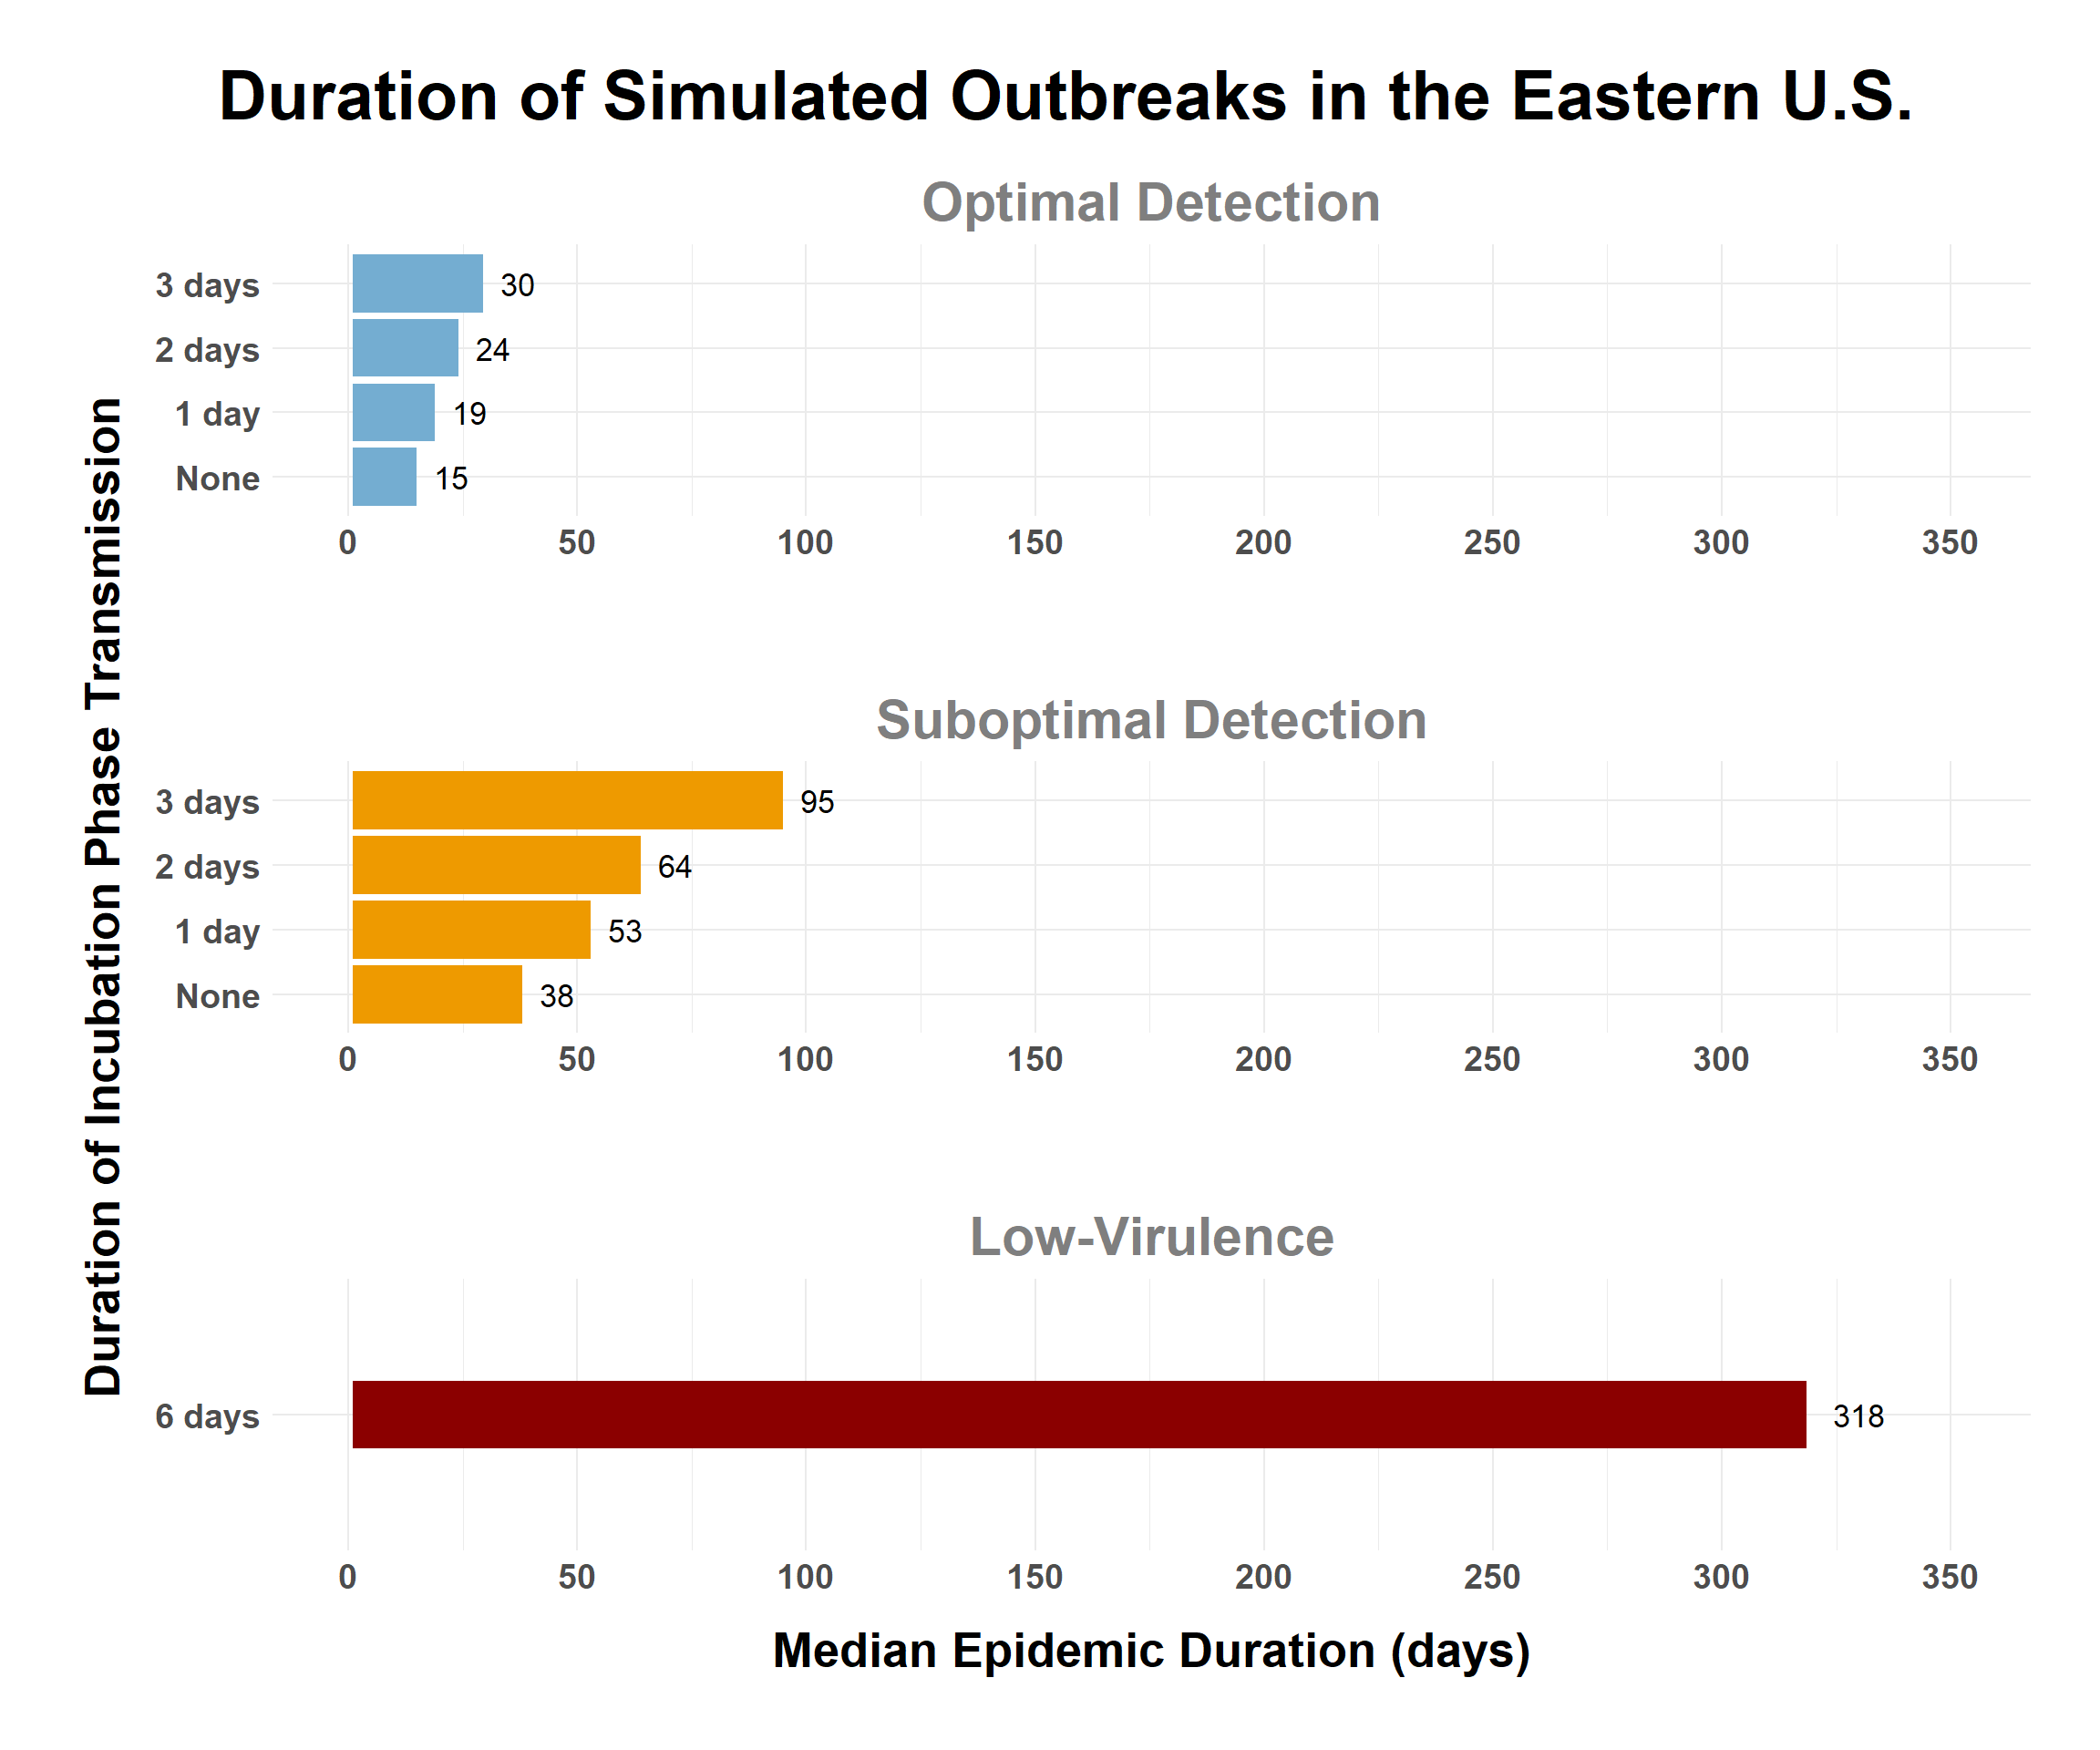
duration_eastern_select| scenario_type | preclinical | mean | q05 | q25 | q50 | q75 | q95 |
|---|---|---|---|---|---|---|---|
| optimal | 0 | 17.26 | 2.00 | 2.00 | 15.0 | 25.00 | 50.00 |
| optimal | 1 | 23.56 | 2.00 | 9.75 | 19.0 | 31.00 | 68.10 |
| optimal | 2 | 32.52 | 2.00 | 14.00 | 24.0 | 41.00 | 94.05 |
| optimal | 3 | 39.92 | 2.00 | 16.00 | 29.5 | 56.25 | 104.10 |
| suboptimal | 0 | 47.75 | 9.00 | 23.00 | 38.0 | 63.25 | 118.05 |
| suboptimal | 1 | 62.65 | 11.95 | 28.00 | 53.0 | 80.00 | 157.10 |
| suboptimal | 2 | 81.34 | 13.95 | 35.00 | 64.0 | 110.25 | 205.25 |
| suboptimal | 3 | 107.55 | 17.95 | 47.00 | 95.0 | 152.25 | 250.00 |
| low-virulence | 6 | 284.67 | 76.95 | 259.75 | 318.5 | 341.00 | 341.00 |
Perform significance testing on optimal and suboptimal detection scenarios
## Filter out low virulence scenarios
no_LV_detect <- detection %>%
  filter(scenario_type != "low-virulence")

no_LV_detect_summary <- summarize_detections(no_LV_detect)## Filter to western region
no_LV_detect_western_summary <- no_LV_detect_summary %>%
filter(region == "western")
model_western_duration <- lm(duration ~ preclinical * scenario_type,
data = no_LV_detect_western_summary)
summary(model_western_duration)
Call:
lm(formula = duration ~ preclinical * scenario_type, data = no_LV_detect_western_summary)

Residuals:
   Min     1Q Median     3Q    Max
-92.62 -22.47  -5.98  17.47 247.38

Coefficients:
                             Estimate Std. Error t value Pr(>|t|)
(Intercept)                    36.177      1.136  31.832  < 2e-16 ***
preclinical1                   11.336      1.607   7.053 2.05e-12 ***
preclinical2                   22.316      1.607  13.885  < 2e-16 ***
preclinical3                   35.245      1.607  21.929  < 2e-16 ***
scenario_type.L                22.906      1.607  14.252  < 2e-16 ***
preclinical1:scenario_type.L    5.442      2.273   2.394 0.016704 *
preclinical2:scenario_type.L    8.132      2.273   3.578 0.000351 ***
preclinical3:scenario_type.L   16.972      2.273   7.467 1.00e-13 ***
---
Signif. codes:  0 '***' 0.001 '**' 0.01 '*' 0.05 '.' 0.1 ' ' 1

Residual standard error: 35.94 on 3992 degrees of freedom
Multiple R-squared:  0.3372,    Adjusted R-squared:  0.336
F-statistic: 290.1 on 7 and 3992 DF, p-value: < 2.2e-16## Filter to central region
no_LV_detect_central_summary <- no_LV_detect_summary %>%
filter(region == "central")
model_central_duration <- lm(duration ~ preclinical * scenario_type,
data = no_LV_detect_central_summary)
summary(model_central_duration)
Call:
lm(formula = duration ~ preclinical * scenario_type, data = no_LV_detect_central_summary)

Residuals:
    Min      1Q  Median      3Q     Max
-117.54  -24.66   -7.84   15.38  227.46

Coefficients:
                             Estimate Std. Error t value Pr(>|t|)
(Intercept)                    32.172      1.479  21.749  < 2e-16 ***
preclinical1                   12.627      2.092   6.036 1.72e-09 ***
preclinical2                   27.352      2.092  13.075  < 2e-16 ***
preclinical3                   49.754      2.092  23.784  < 2e-16 ***
scenario_type.L                23.097      2.092  11.041  < 2e-16 ***
preclinical1:scenario_type.L    9.214      2.958   3.114  0.00186 **
preclinical2:scenario_type.L   20.475      2.958   6.921 5.21e-12 ***
preclinical3:scenario_type.L   30.094      2.958  10.172  < 2e-16 ***
---
Signif. codes:  0 '***' 0.001 '**' 0.01 '*' 0.05 '.' 0.1 ' ' 1

Residual standard error: 46.78 on 3992 degrees of freedom
Multiple R-squared:  0.3411,    Adjusted R-squared:   0.34
F-statistic: 295.3 on 7 and 3992 DF, p-value: < 2.2e-16## Filter to eastern region
no_LV_detect_eastern_summary <- no_LV_detect_summary %>%
filter(region == "eastern")
model_eastern_duration <- lm(duration ~ preclinical * scenario_type,
data = no_LV_detect_eastern_summary)
summary(model_eastern_duration)
Call:
lm(formula = duration ~ preclinical * scenario_type, data = no_LV_detect_eastern_summary)

Residuals:
     Min       1Q   Median       3Q      Max
-105.550  -22.672   -7.752   14.447  256.664

Coefficients:
                             Estimate Std. Error t value Pr(>|t|)
(Intercept)                    32.505      1.366  23.791  < 2e-16 ***
preclinical1                   10.600      1.932   5.486 4.37e-08 ***
preclinical2                   24.423      1.932  12.640  < 2e-16 ***
preclinical3                   41.228      1.932  21.338  < 2e-16 ***
scenario_type.L                21.563      1.932  11.160  < 2e-16 ***
preclinical1:scenario_type.L    6.073      2.733   2.222   0.0263 *
preclinical2:scenario_type.L   12.956      2.733   4.741 2.20e-06 ***
preclinical3:scenario_type.L   26.262      2.733   9.611  < 2e-16 ***
---
Signif. codes:  0 '***' 0.001 '**' 0.01 '*' 0.05 '.' 0.1 ' ' 1

Residual standard error: 43.2 on 3992 degrees of freedom
Multiple R-squared:  0.3075,    Adjusted R-squared:  0.3063
F-statistic: 253.2 on 7 and 3992 DF, p-value: < 2.2e-16anova(model_western_duration)| Df | Sum Sq | Mean Sq | F value | Pr(>F) | |
|---|---|---|---|---|---|
| preclinical | 3 | 682019.6 | 227339.875 | 176.01363 | 0 |
| scenario_type | 1 | 1865678.4 | 1865678.442 | 1444.46647 | 0 |
| preclinical:scenario_type | 3 | 75264.4 | 25088.135 | 19.42402 | 0 |
| Residuals | 3992 | 5156082.5 | 1291.604 | NA | NA |
anova(model_central_duration)| Df | Sum Sq | Mean Sq | F value | Pr(>F) | |
|---|---|---|---|---|---|
| preclinical | 3 | 1370030.7 | 456676.909 | 208.70868 | 0 |
| scenario_type | 1 | 2894493.8 | 2894493.800 | 1322.83017 | 0 |
| preclinical:scenario_type | 3 | 258144.5 | 86048.159 | 39.32539 | 0 |
| Residuals | 3992 | 8734922.7 | 2188.107 | NA | NA |
anova(model_eastern_duration)| Df | Sum Sq | Mean Sq | F value | Pr(>F) | |
|---|---|---|---|---|---|
| preclinical | 3 | 955037.2 | 318345.721 | 170.54314 | 0 |
| scenario_type | 1 | 2162854.5 | 2162854.542 | 1158.67744 | 0 |
| preclinical:scenario_type | 3 | 190807.1 | 63602.367 | 34.07285 | 0 |
| Residuals | 3992 | 7451698.8 | 1866.658 | NA | NA |
plot_epidemic_duration() returns a plot with median epidemic duration (days) on the x-axis and the duration of incubation phase transmission on the y-axis.
central_duration_plot <- plot_epidemic_duration(duration_central_summary, "central")

central_duration_plot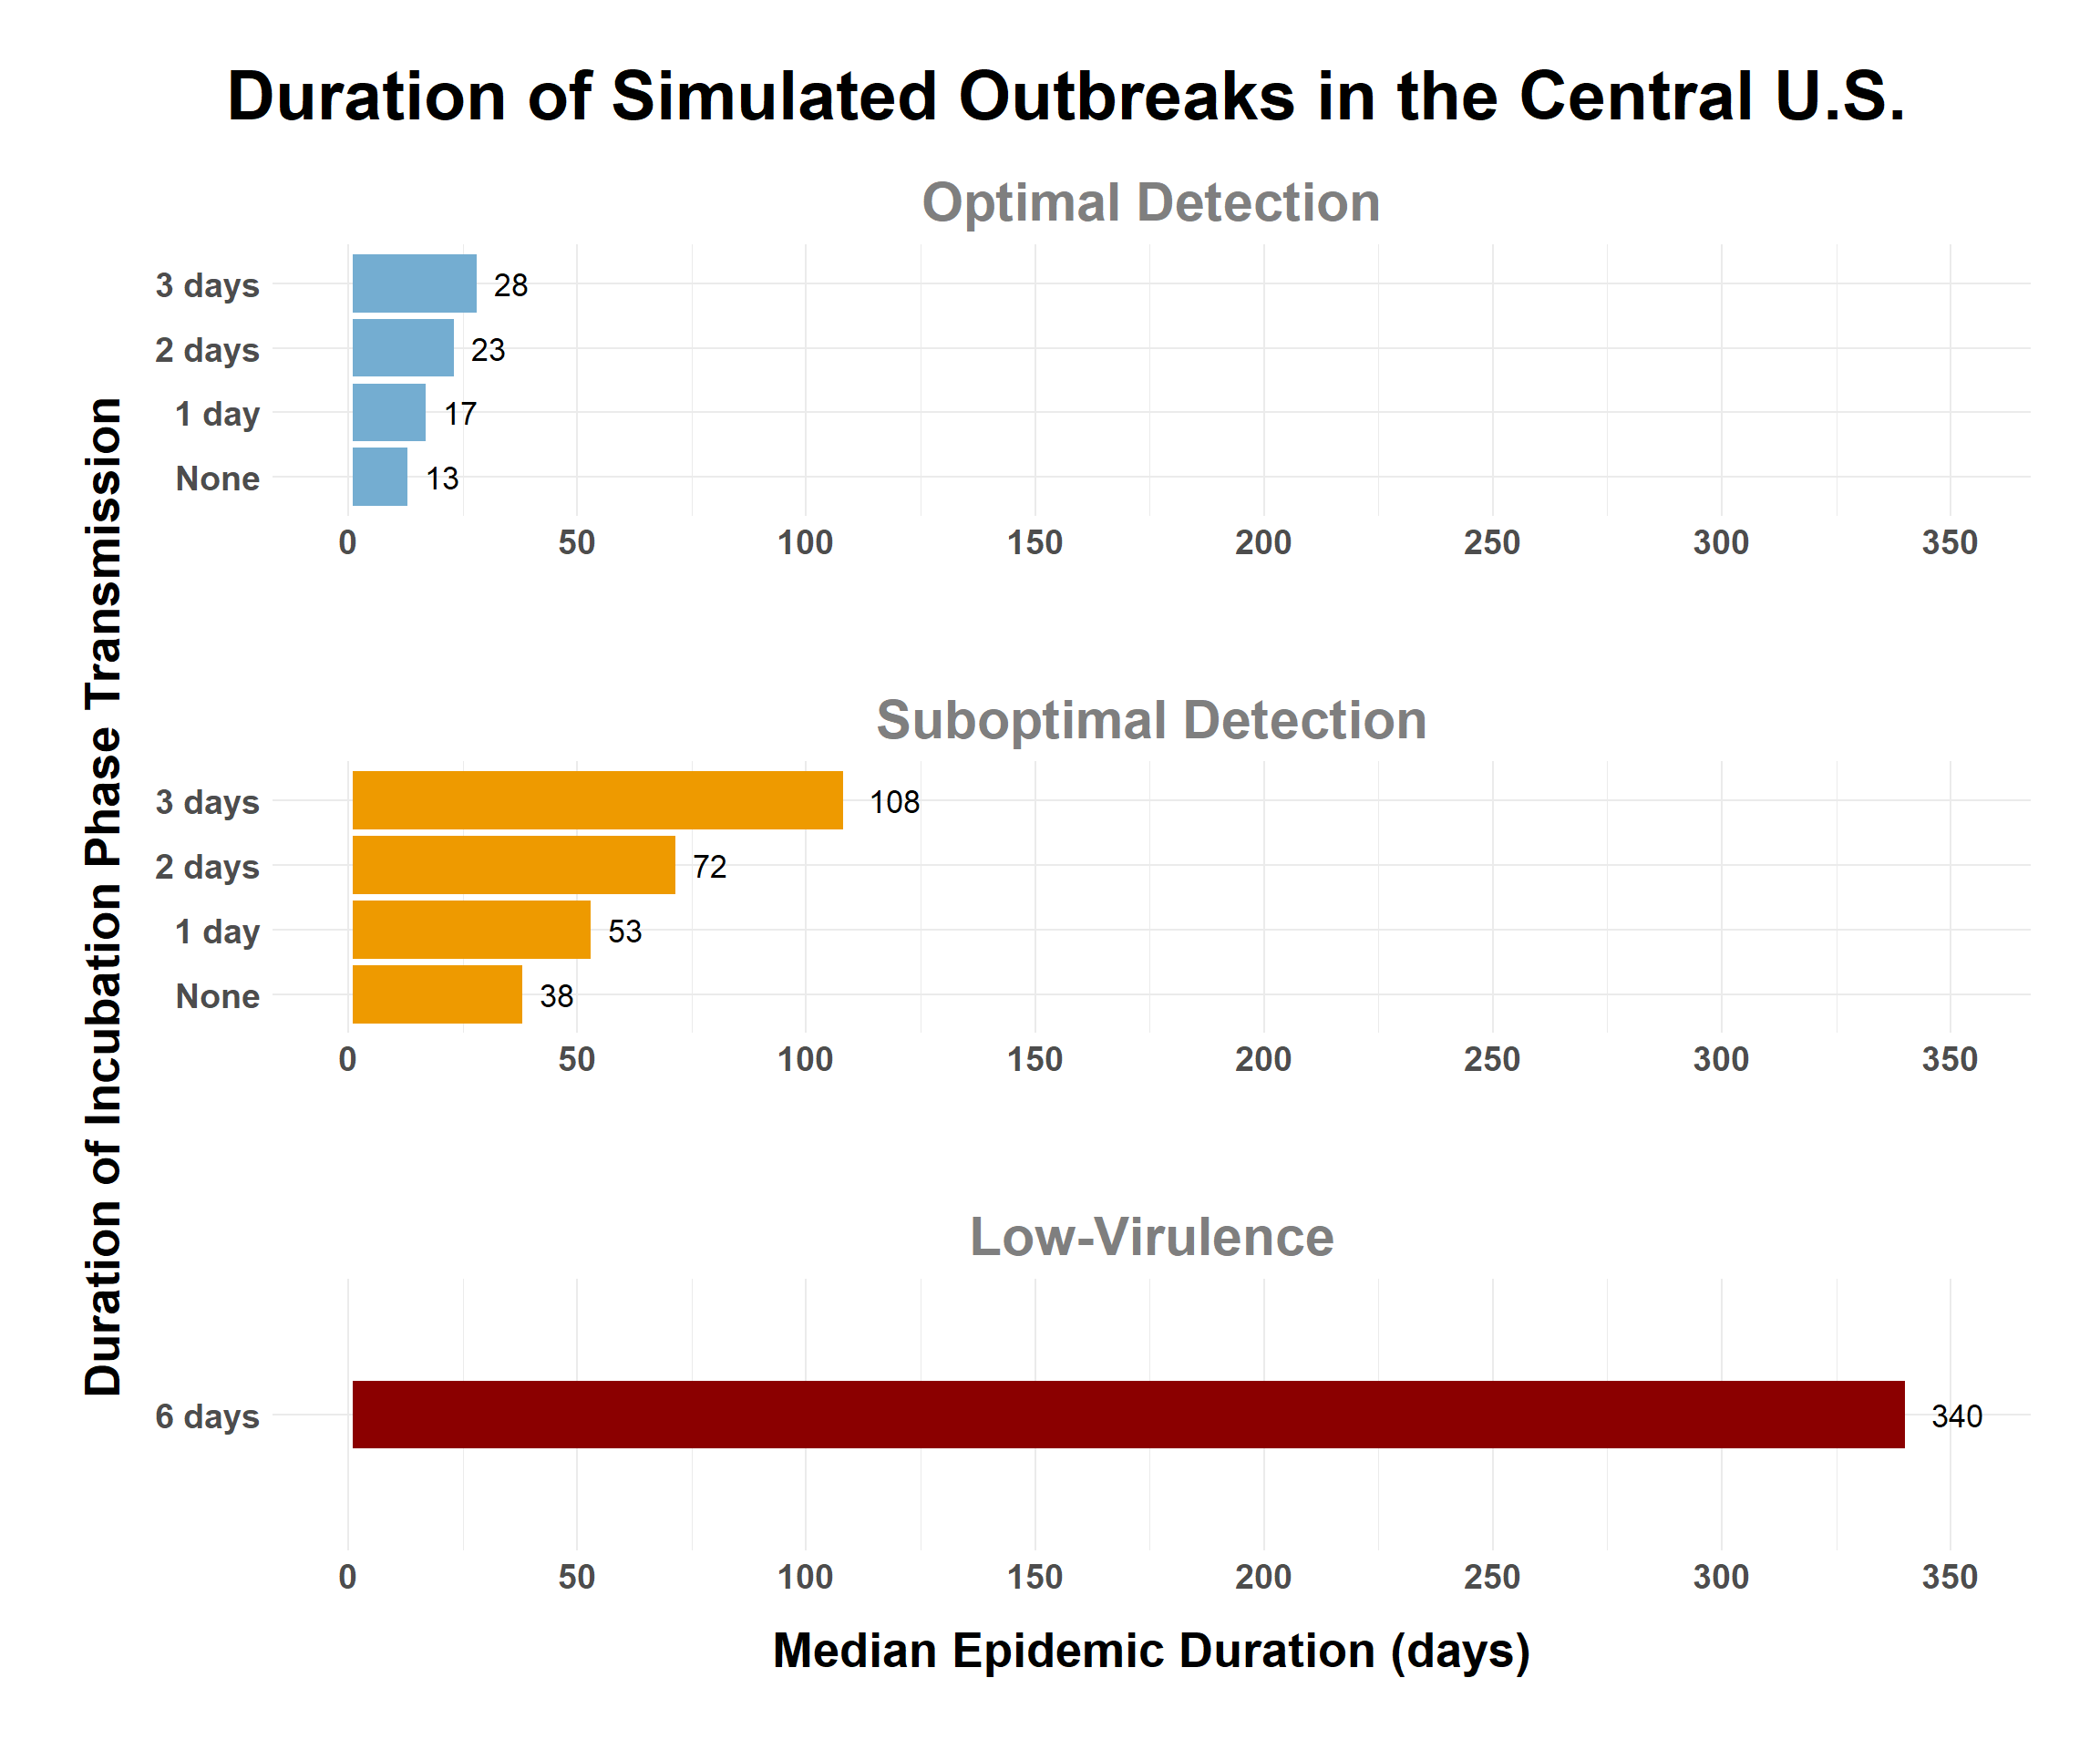
eastern_duration_plot <- plot_epidemic_duration(duration_eastern_summary, "eastern")

eastern_duration_plot