Compartmental Models
Scenario-based simulation to compare estimated latent, subclinical, and incubation rates.
Under Construction
Work in progress!
SEIIR Model
Basic model
Hide code
seiir_model <- function(times, state, parameters) {
  with(as.list(c(state, parameters)), {

    dS <- -beta * S * (I_sub + I_clin) / N
    dE <- beta * S * (I_sub + I_clin) / N - sigma * E
    dI_sub <- p_sub * sigma * E - lambda * I_sub
    dI_clin <- (1 - p_sub) * sigma * E + lambda * I_sub - gamma_clin * I_clin
    dR <- gamma_clin * I_clin

    sub_inc <- p_sub * sigma * E
    clin_inc <- (1 - p_sub) * sigma * E + lambda * I_sub

    list(c(dS, dE, dI_sub, dI_clin, dR), sub_inc = sub_inc, clin_inc = clin_inc)
  })
}

# initial values
initial_state <- c(
  S = 999,
  E = 1,
  I_sub = 0,
  I_clin = 0,
  R = 0
)

# sampling distributions
param_distributions <- list(
  beta_meanlog = log(0.3), beta_sdlog = 0.1, # ??
  sigma_meanlog = log(1/1.3290530), sigma_sdlog = 0.1, # study average per AFT
  lambda_meanlog = log(1/2.4793733), lambda_sdlog = 0.1, # study average per AFT
  gamma_clin_meanlog = log(1/10.8), gamma_clin_sdlog = 0.1, # Shankar's 2019
  p_sub_shape1 = 10, p_sub_shape2 = 5, # prob of I_sub -> I_clin ~0.68-0.75
  N = 1000 # herd size
)
Run Simulation
Hide code
full_results <- simulate_SEIIR_intervention(seiir_model,
                                            param_distributions,
                                            initial_state,
                                            n_iterations = 1000,
                                            timesteps = 200)
Plot dynamics
Hide code
plot_seiir_dynamics(full_results$summary, plot_title = "Burn Through")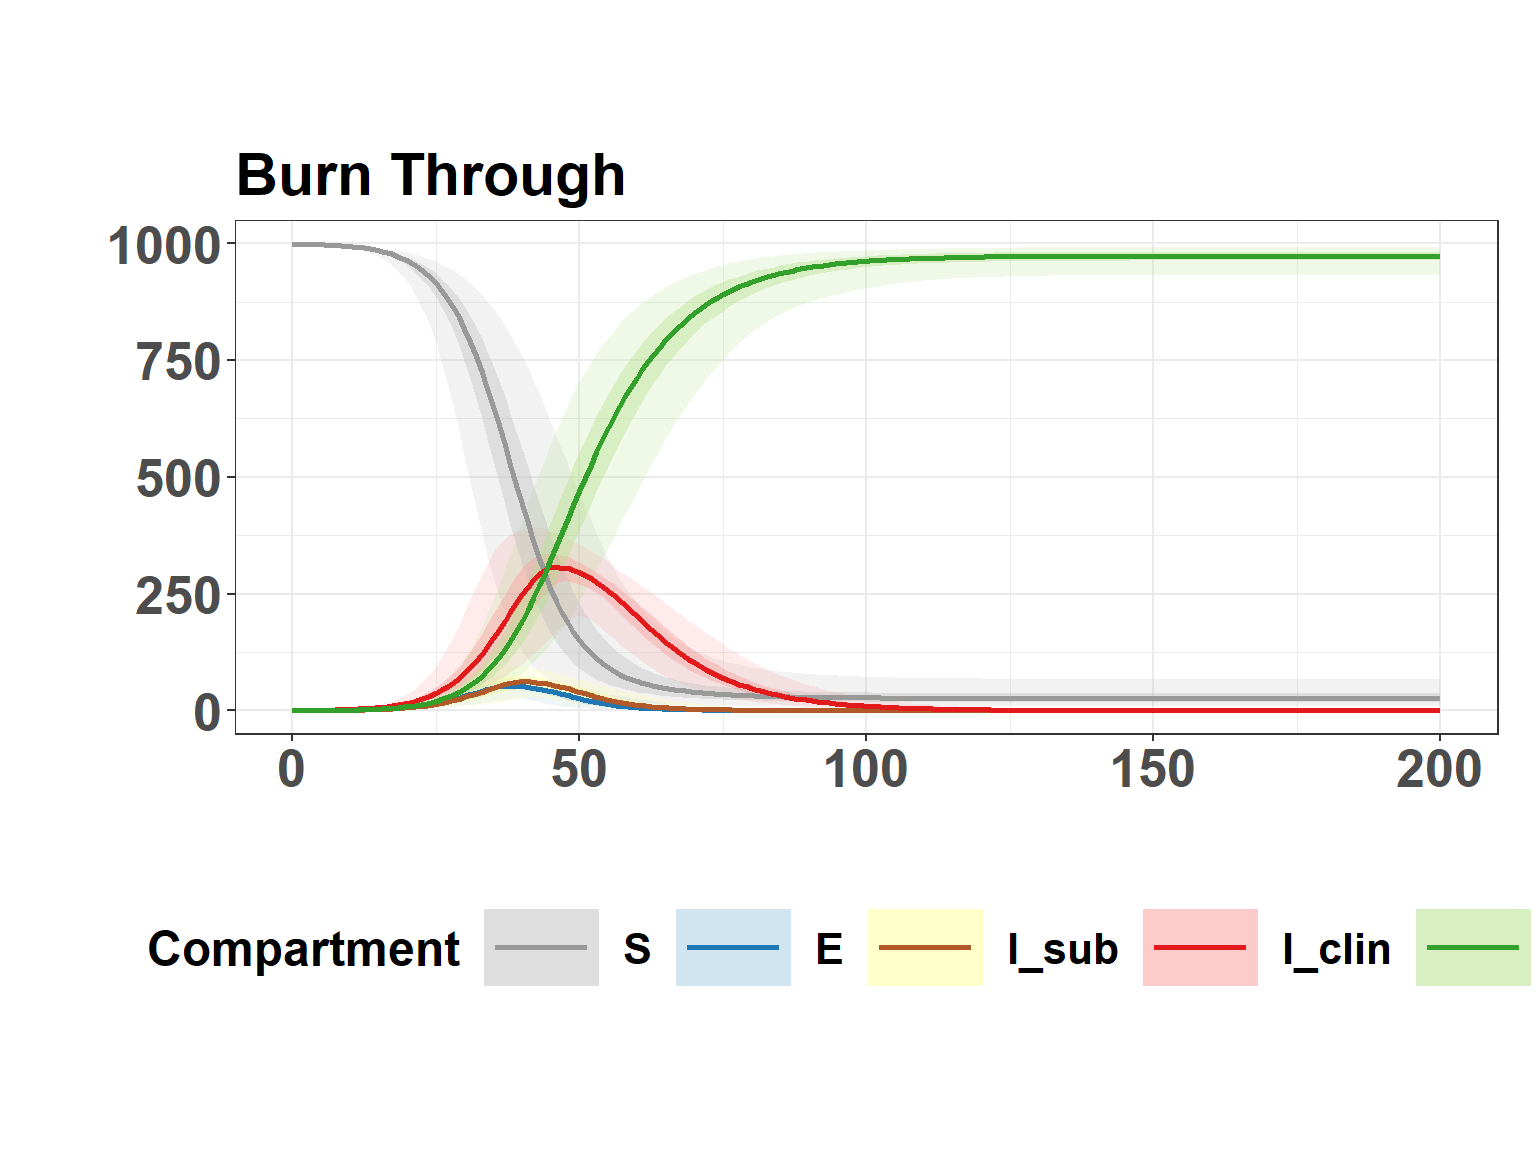
Plot incidence
Hide code
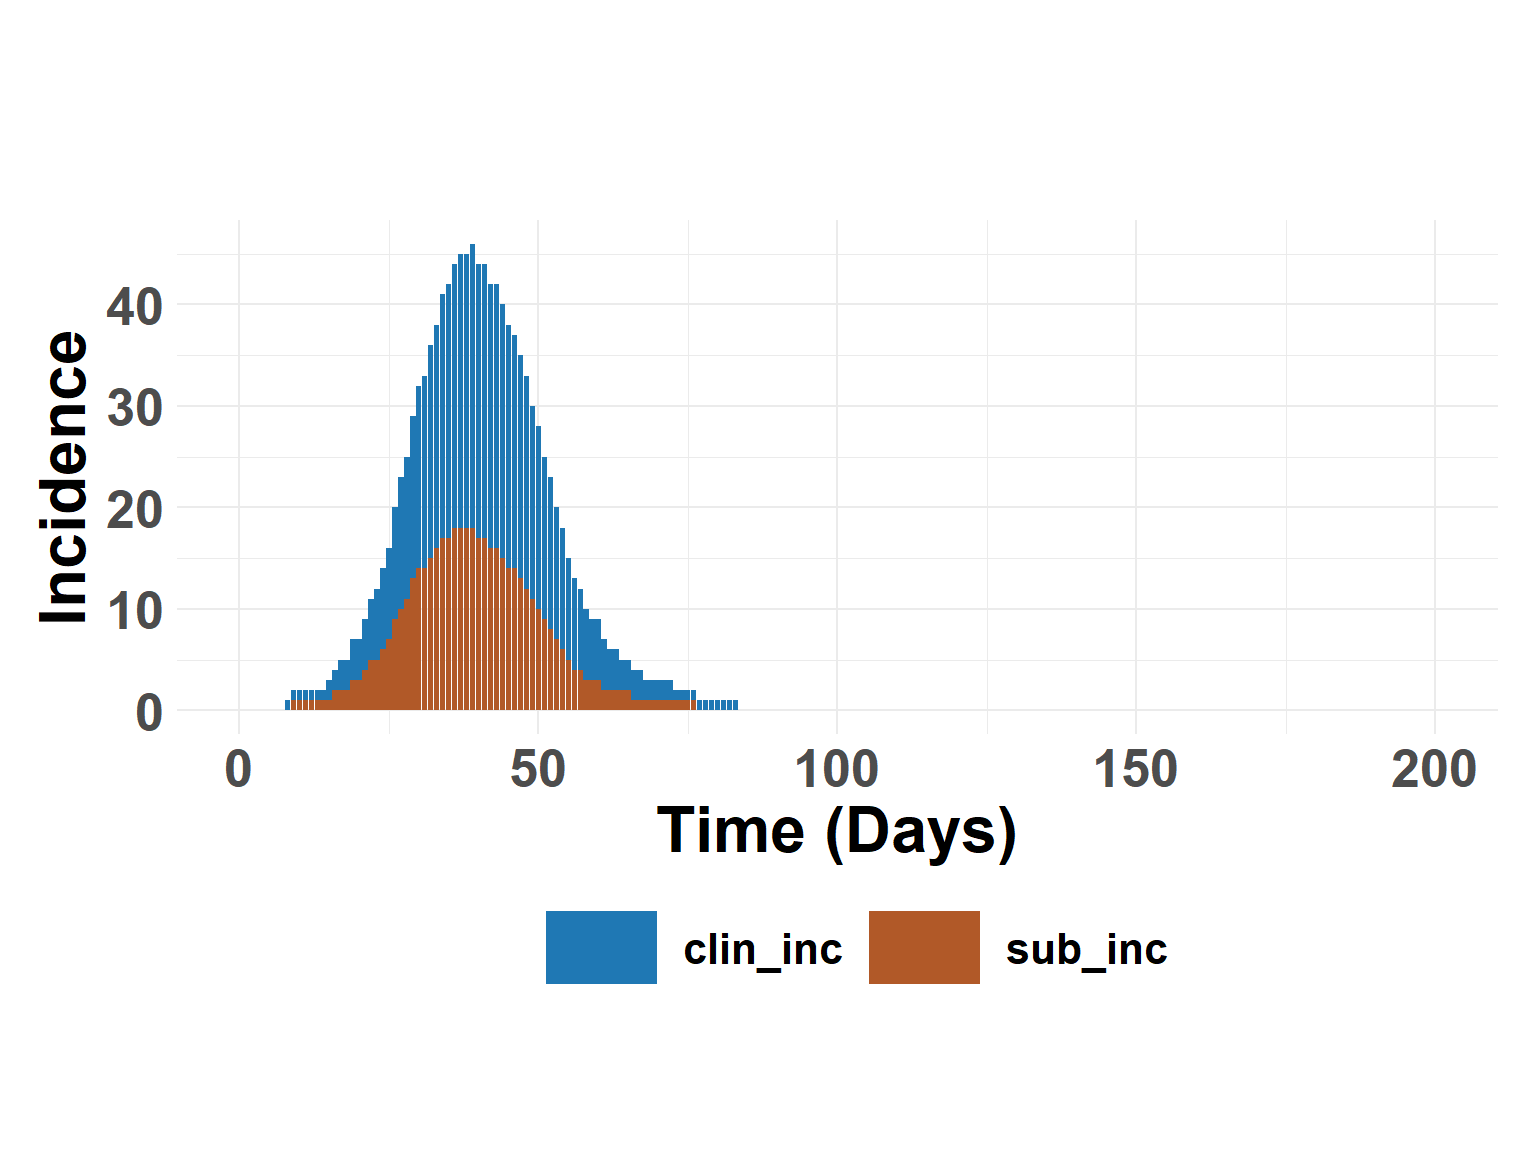
ratio_out <- calculate_ratio_subclinical(full_results$summary)
ratio_out$total[2]/ratio_out$total[1]
[1] 0.6383648Hide code
plot_incidence_bar(full_results$summary)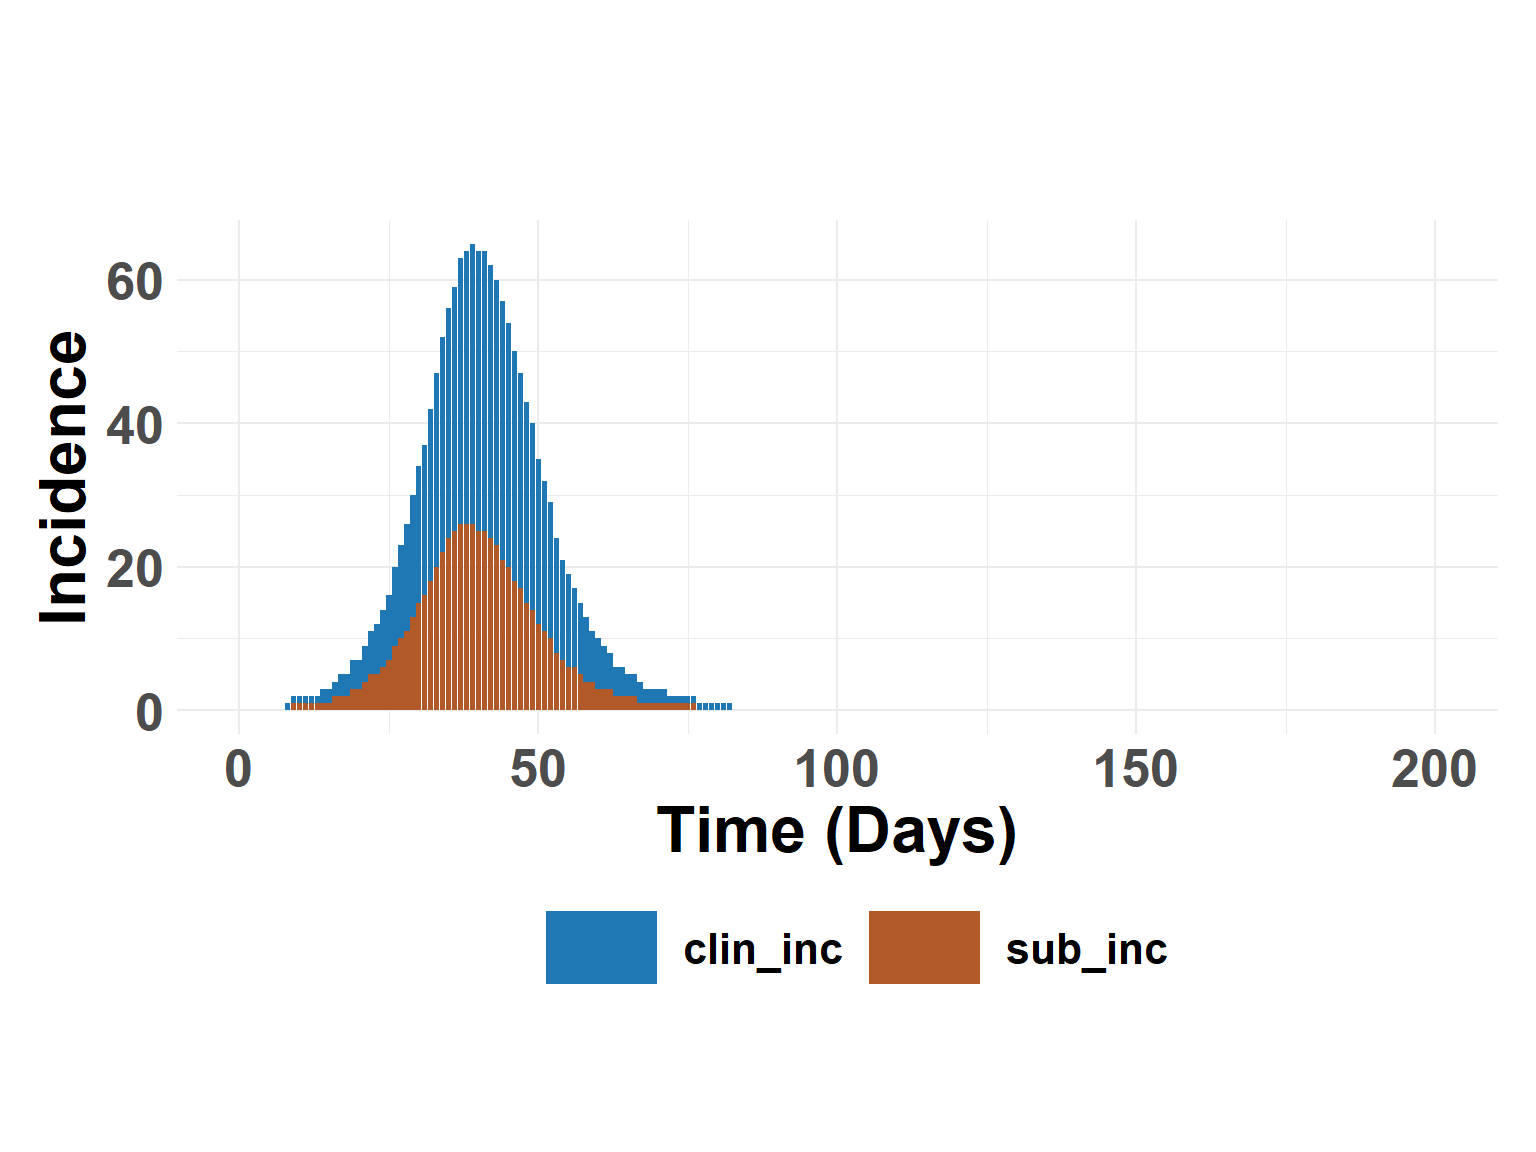
Simulation with Intervention
Hide code
interv_results <- simulate_SEIIR_intervention(seiir_model,
                                              param_distributions,
                                              initial_state,
                                              n_iterations = 1000,
                                              timesteps = 200,
                                              detect = 3, # when clinical cases >= detect, 3 per Backer 2012
                                              vacc_effect = 0.20, # effectiveness
                                              immune_param = c(7, 1) # mean and sd for delay before immunity
                                              )
Time of intervention
Hide code
interv_time <- interv_results$all_results %>%
  filter(I_clin >= 3) %>%
  slice_head(n = 1) %>%
  pull(time)

interv_time
[1] 13Plot intervention dynamics
Hide code
plot_seiir_dynamics(interv_results$summary, plot_title = "Intervention", vline=interv_time)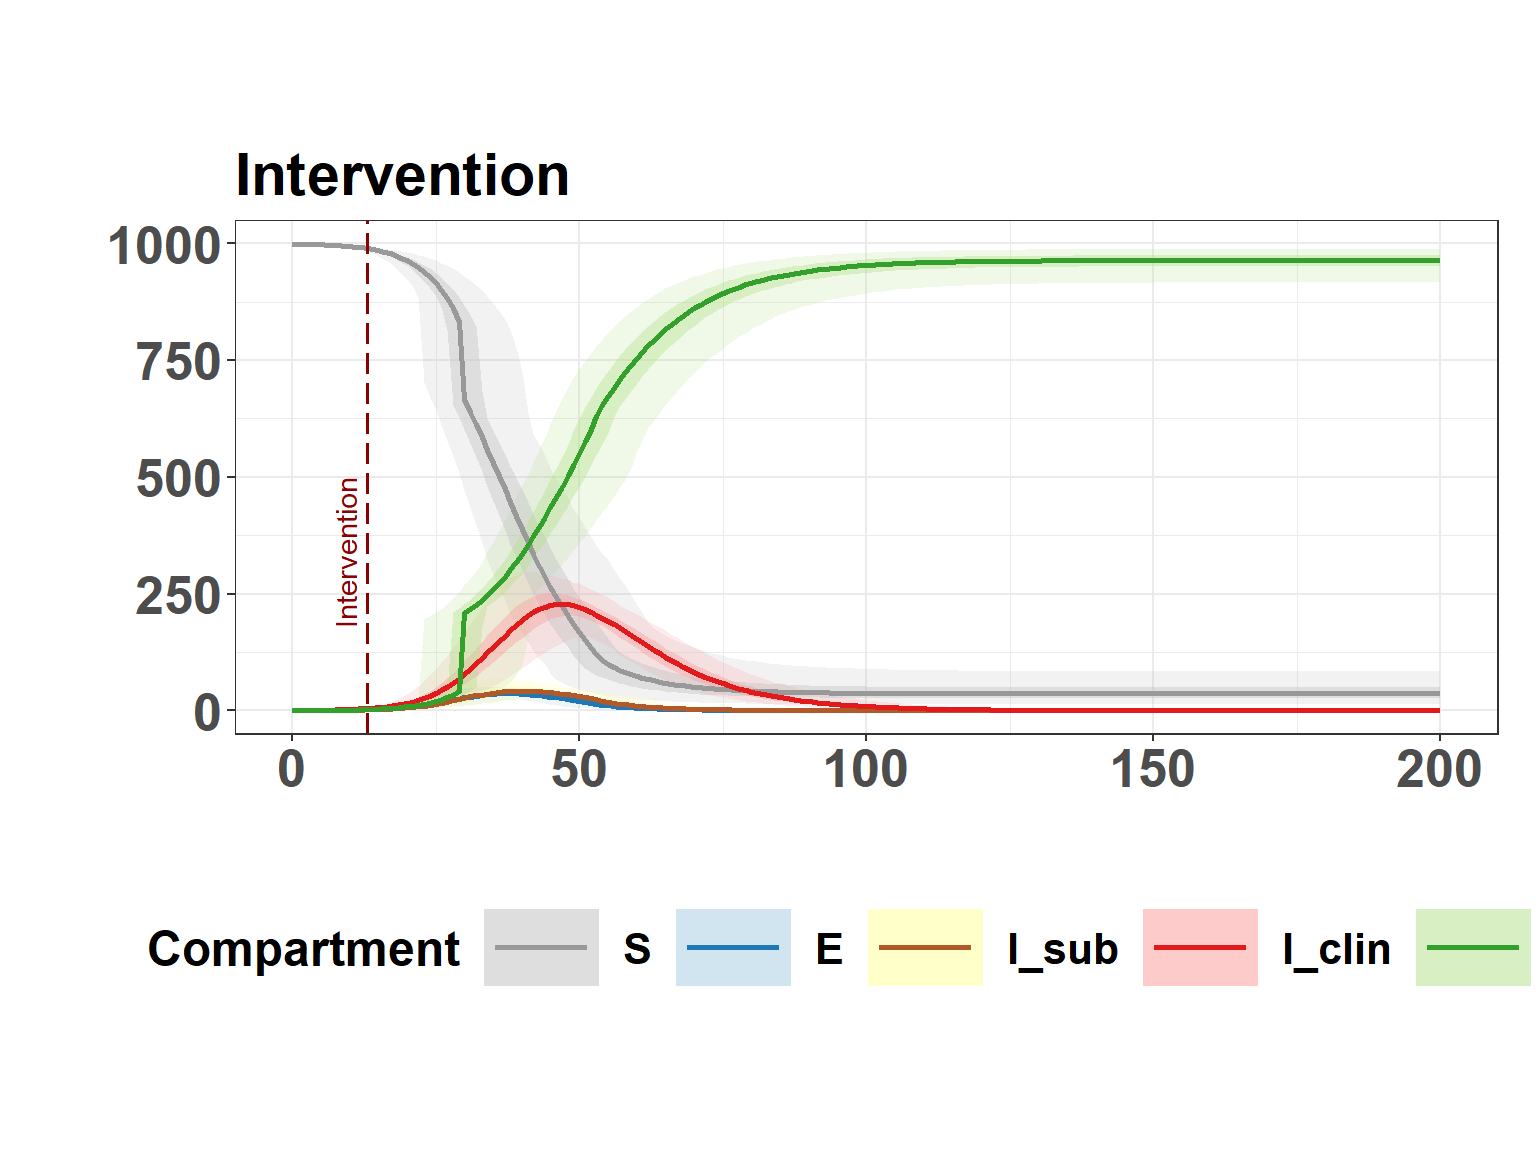
Plot incidence
Hide code
ratio_out <- calculate_ratio_subclinical(interv_results$summary)
ratio_out$total[2]/ratio_out$total[1]
[1] 0.6367239Hide code
plot_incidence_bar(interv_results$summary)